There is a slow and steady erosion happening across a group of businesses that most investors have associated with deep moats and perpetual strength. This is similar to the frog-in-boiling-water analogy, where the risks are not immediately visible. But once one steps back and looks at the longer picture, the numbers are most obvious.
We are talking about a collection of consumer brands across markets. Some of them are decades old with a hallowed history, relatively strong brand recall and, often, category leadership. These companies are across geographies and include products like food, cosmetics, hygiene and alcohol.
The broad facts are that there has been a very marked slowdown in the growth rate of these businesses across the board, in terms of both sales and earnings. Though global nominal GDP growth has slowed, the slowdown in this sector is sharper. Also, this is a slowdown across geographies and subsectors.
The reasons for this are multi-fold but, broadly, it has to do with a lack of innovation, hollowing out of the mid-market customer base and a loss of monopolistic control over the distribution chain.
The Great Deceleration
There has been a marked slowdown in growth rates across market leaders in consumer products defined as “consumer staples”. We have looked at this term “consumer staples” broadly, and included stocks in FMCG, food, sportswear, alcohol, etc. We could have expanded this further with similar outcomes. The broad consistency is that they span product categories which have been in existence for long and have brands which are market leaders with a long history.
In this newsletter, we compare their growth across two 10-year time frames: 2003-2013 and 2013-2023. We have looked at five broad geographies – the U.S., Eurozone, Japan, China and India. Additionally, we have looked at growth in revenue, earnings and EPS and have compared these to the nominal GDP growth over the same time frame.
The conclusion is unequivocal: these businesses have slowed down dramatically.
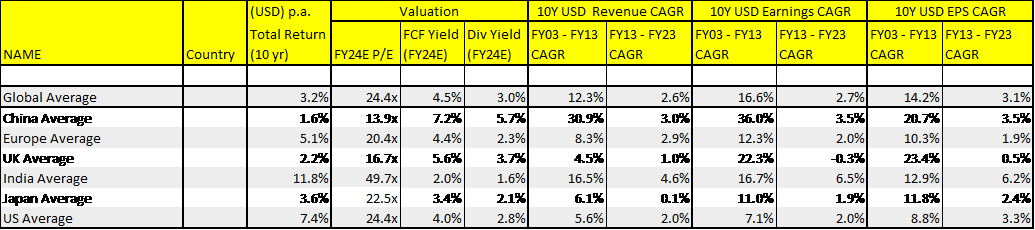
Source: RVAM and Bloomberg
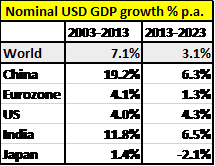
We have taken a sample of 34 companies to arrive at the data in the table above. The average revenue growth has slowed down from 12.3% p.a. to only 2.6% p.a. This means that it has slowed from about 1.7x global GDP growth in the first 10-year period to only 0.8x in the later 10-year period, with this trend broadly across geographies. There is a sharper slowdown in earnings growth.
In terms of geographies, the sharpest revenue slowdown has been in China from 31% p.a. to 3% (though it still remains the second-best growth rate). Even India has slowed down dramatically from 16.5% to 4.6%.
An interesting point to note here is that stock returns (as in the third column of the table above) have not necessarily tracked earnings growth. In markets like China, stock returns are much lower than earnings growth, while in India and the U.S., stock returns are much higher. This is in spite of annual earnings growth being within 1% of each other. Markets like Eurozone, the UK and Japan have the worst growth.
This dichotomy can be primarily explained by the current PE multiples. While the second 10-year earnings growth in India was 6.2% p.a. and that in China was 3.5% p.a., the Indian PE is 50x compared to 14x for China. The U.S., with a 3.3% earnings growth, is at 24x PE. This is all because of the current diametrically opposite narratives in these markets. The historic numbers do not exactly match the narrative.
The table below shows the numbers for the 34 sample companies.

Source: RVAM and Bloomberg
In the 2003-2013 period, only 8 of the 34 stocks grew revenue at less than 5% p.a. But in the 2013-2023 period, 31 of the 34 stocks grew revenues at a pace of 5.3% p.a. or below – the three exceptions being Moutai, LVMH and Nike, with only Moutai growing in double digits. Even the much-valued and much-loved Indian names (average PE of 50x) grew at best at 5.3% p.a. in USD terms.
So, however deep a moat, however long the history of the brand, however high the ranking in brand surveys, if the long-term numbers are not good enough then why are these stocks so highly regarded? Why do most of them have the high PEs that they do? Some people might answer that by saying the slow down – even though it is spread over a decade – is temporary and the growth will come back somehow. We differ. We think there are structural issues here.
Why This Slowdown? Lack Of Innovation
Lack of innovation is a big issue across these product categories. The last big innovation from FMCG brands was the 3-in-1 shampoo. If one walks into a supermarket today, it is difficult to find any new innovative products in the FMCG section. What is touted as new is often just a small twist in terms of flavour, limited edition, etc. Even if there is a new product, it tends to be from lessor known, smaller and nimbler brands. A new ice cream flavour like matcha, niche yogurt brands like Chobani, a new alcohol blend like “plum prosecco” or even new healthier foods like “Impossible Foods” did not come from the existing food brands. Most of the larger companies/ brands were, at best, followers, and hence missed out on the big growth.
The reason why this happens is primarily because these brands play it safe. Many brands cling to their category definitions and the efficiency of their existing business models. They are so dedicated to their heritage and values that they leave little room for new ideas. They have a huge disincentive to stray from the decades-old personality of hugely profitable existing brand. This creates a disproportionate risk-reward for the brand manager in terms of trying out something new and radical. Incremental change is the most obvious path for him or her. Also, any smaller successes they have in terms of innovative products if not scaled up fast enough tend to be drowned by the larger existing profit pool and, hence, tend to lose management attention and funds allocation to nurture it to the next stage.
This is not true only in FMCG. For example, an ASICS, On or a re-invented Crocs did not come from within Nike’s sportwear or casual wear shoe division, even though Nike claims to have an inordinate focus on innovation.
Why This Slowdown? Hollowing Out Of The Middle Market

This is one of the fallouts of the increasing income inequality over the past few decades (as seen in the chart below). As inequality increases, the rich have gotten richer and the poor poorer in relative terms. The net impact is a hollowing out of the middle: either one has climbed up significantly or has gone down significantly. This is borne out by oft-used terms like the “K shaped recovery” and “hollowing out of the middle class” and manifests in the populist upswing across the world.
Unfortunately, most of our brand companies have traditionally catered to the middle class. Neither are they in the top end luxury space nor are they at the value-focused bottom of the pile competing with private labels. Hence, they have seen their natural consumers either move up to luxury brands or down to value-for-money products.
Why This Slowdown? The Online Revolution
This is probably the most important reason for the slowdown in sales of these businesses. The second 10-year period has seen a revolutionary change in the way we buy any product. As online sales moved from 0-2% of total sales in 2003 to 20-30% in 2024 across various geographies, it dramatically changed the bargaining power of the existing brands.
Large brand owners had a quasi-monopolistic hold over two sets of real estate – the aisle space in a supermarket and the advertising space in print or TV. They could bully most of the retailers into getting the best space and thus keep out new upstarts. Since the space was finite, the newcomers had nowhere to start. Their products struggled to reach the consumer.
Also, the large brand owners could arm twist the media agencies to give them the best slots. Again, as the slots were finite, the media outlets had to sell a large chunk to these large brand owners. Not only would they ensure that their most popular brands got the best space, but also that the rest of the space went only to their own newer and less recognised brands. For a new product from a new brand, it was very difficult to get good ad space or aisle space in a retail outlet.
All this changed with the advent of e-commerce. So called “aisle space” now became infinite as online one could have page after page of products on the website. So even though a new product might not be on the first page, the consumer could have access to it on the later pages. Additionally, for a new brand, new ways to tell their story came up. Ad real estate grew exponentially online compared to the old fashion offline ad space. This dramatically eased the ability of new innovative brands to tell their story and be heard. Social media advertising, the activity of influencers, etc. mean that even the online ad inventory is evolving and growing.
These two factors – large increase in “aisle space” and large increase in ad real estate – resulted in the dilution of monopolistic power of incumbent brands.
Add to that the consolidation of the distribution chain. Imagine the distribution power improvement as we move from a small mom-and-pop store to giant distributors like Amazon or even Walmart or Costco. Clearly, the power of the distributor has increased dramatically.
Finally, the concept of house brands. This is a consequence of the strength of the distributor. A Walmart or an Amazon can have cheap house brands, which a mom-and-pop shop cannot. As the former become stronger, they have the ability to put out a large selection of house brands across categories. This hits the brand leaders too.
Conclusion
Be wary of investing in these old brand leaders just based on their brand strength and growth of the early 2000s. Without innovation, these brands are getting outflanked by nimbler and more creative new companies. The risk is especially high when some of these older companies are trading at unsustainably higher valuations.
Cover photo by Bernard Hermant on Unsplash
End
Disclaimer
This material is not intended as an offer or solicitation for the purchase or sale of any financial instrument. Information has been obtained from sources believed to be reliable. However, neither its accuracy and completeness, nor the opinions based thereon are guaranteed. Opinions and estimates constitute our judgement as of the date of this material and are subject to change without notice. Past performance is not indicative of future results. This information is directed at accredited investors and institutional investors only.