The current stress that markets and global economies are going through because of the tariff and trade reset that the US is attempting has a bigger underlying reason. It is the ballooning US debt and its debt service load. US trade deficit is just one side of the coin, the other side being the US capital surplus. The US has seen an inflow of capital for years, both in the form of debt investors and equity investors. Whether a large Middle Eastern wealth fund buys US treasuries or an individual investor from Singapore buys a FAANG stock, it is part of this same capital inflow into the US. The largest receiver of this inflow is the US government. In addition, the US government also borrows from domestic investors and has cumulatively been a huge borrower for the past 30 plus years.
Like for all borrowers when they first start borrowing, the lenders are happy to lend. But, as the total borrowed amount approaches a certain critical level, the lenders start getting skittish and slowly start disappearing. This, for an entity like the US government, does not happen overnight, but the process has potentially started. Global and local lenders to the US government are increasingly reluctant to lend more. At the minimum, they want to be paid a lot more for the risk they take in lending to a “weak” borrower.
The impact of this withdrawal is going to be multi-fold. It is linked to the tariff/ trade wars. We could soon see a rise in US rates, especially relative to rest of the world. In fact, we are already seeing that. US tax rates could go up, especially corporate tax rates. Finally, the real unthinkable is a US debt default/ restructuring. This final one has suddenly become a non-zero probability event, which in itself is going to have repercussions.
This is the new regime in which we will need to construct our portfolio.
The US Budget And Borrowings: Increasingly Stretched And With A Low Level Of Flexibility
The current US borrowing is already at dangerous levels, whichever way one looks at it. The stock of lending is getting too high. The flow of new lending also shows no sign of abating. Most importantly, the debt service cost is going towards a level where the US could be in a debt trap within the next five years i.e. where the annual incremental borrowing is fully used up to just repay the interest on the existing borrowings. These are the kind of traps one associates with countries like Zimbabwe or Argentina – not the US government.
- Debt levels are too high and are accelerating up
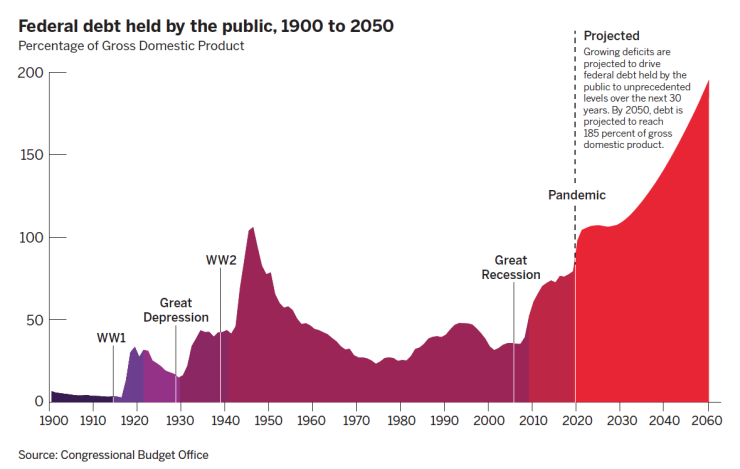
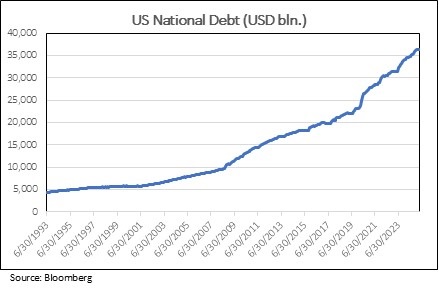
As seen in the charts below, the US national debt has been shooting up both in absolute terms and as a percentage of GDP. The absolute debt has gone up by 75% in the past ten years (Trump’s first term and Biden’s term). In relative terms, it has gone past the 100% of GDP level for the first time since the post WW2 construction boom of the late 1940s. This relative chart shows only the government debt held by the public. If you include the debt held by the Fed itself, the total debt is now already at about 120% of GDP.
The issuance is accelerating up as seen in the chart alongside. Our projection is that, over the next six years, gross issuance will average USD 8-9 trln. p.a. and the net issuance will be USD 2.5 trln. p.a. This is a lot of borrowing to be done by a borrower in whom the lender is losing faith. This requires the “US exceptionalism” story to remain and grow stronger. In reality, this story is actually weakening and the US is spoiling its relationship with most of its creditors.

2. The budget is stretched and has very low flexibility to help the US deleverage
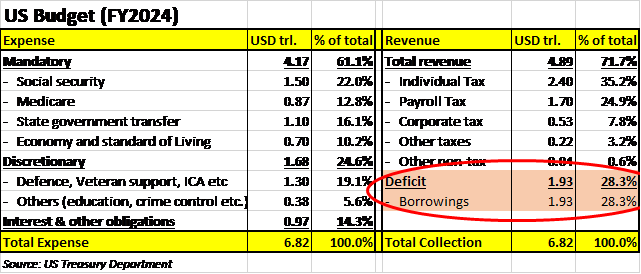
A snapshot of the US budget for FY 24 is shown in the table below. A few shocking facts stand out.
- 28% of the expenses are funded by borrowings. This is like a man who is deep in debt continuing to borrow large amounts to fund his lifestyle.
- Most of the cost line items have low flexibility as most are long term commitments like Social Security, Medicare, state government share, defence and interest costs.
- 80% of the tax collection is from individuals (individual tax and payroll tax). The load on corporates is only about 10% of the tax collected. This is shocking especially given that corporate America has had one of the largest profit booms in the past ten years. The social angst of America is partly explained by this. Also, now we can understand why corporate America so keen to have a say in how this re-alignment is done. But this re-set is clearly required and, when it happens, it could be disastrous for financial markets.
3. Non-zero chance of the US getting into a debt trap by 2030
This has clearly started worrying players who matter. Financial market players like Howard Marks have become very vocal on this front. Also, some people in the Trump inner circle are clearly worried on this front. A lot of the hasty and apparently incoherent action on reduction of trade deficit and creation of DOGE is driven by this same impending crisis.
The simple math on our assertion of 2030 being a stress point is shown in the table alongside. We just assume two things: an annual deficit of USD 2.5 trln. p.a. till 2030 and average borrowing cost of 5% p.a. by 2030. This would take the debt to USD 50 trln. by 2030 (from USD 35.5 trln. in 2024) and the interest cost would jump to USD 2.5 trln. p.a. by 2030 from the USD 1.06 trln. expected in 2025. We realise that this is a linear extrapolation and that never is true in real life. But that is exactly the point – something will have to give and not necessarily in a way good for financial markets and the US.

The Lenders Know The Risk And They Are Moving Away
Global lenders to the US are getting angsty. They are looking for alternatives. While nothing matches up to the size and history of the USD and US debt, the relative attractiveness of other alternatives is improving. Gold is the obvious alternative. Currencies like the EUR, JPY and the RMB have their own believers. And this group is growing. For the younger crowd, the hope is that Crypto would be a genuine alternative; but this asset class still needs to grow out of its teen years and become a less temperamental adult.
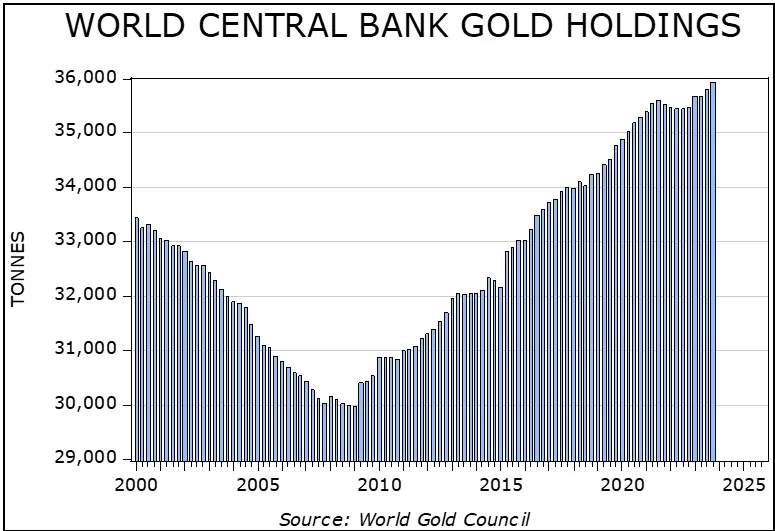
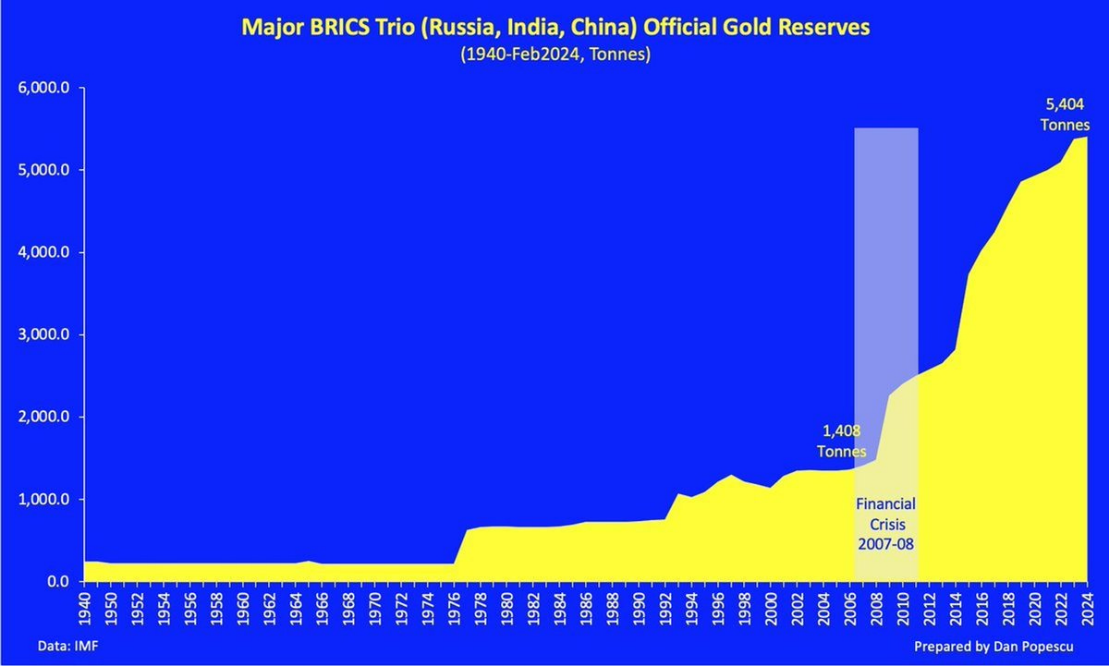
- Central banks’ increasing gold allocation: Central bank gold demand has been accelerating up, especially after the Russian invasion of Ukraine and the seizing of Russian USD assets by the West. The acceleration has been sharp in China, Russia and India. From the two charts below, one interesting fact that emerges is that 67% of the increase in central bank gold reserves across the world since 2008 has been in the central banks of these three countries. Also, this build up is now slowly spreading to other central banks as an increasing number of countries fear the weaponisation of the dollar by the US. Combine this with gold as a genuine investment option for private wealth, and we have created a genuine alternative to the dollar.
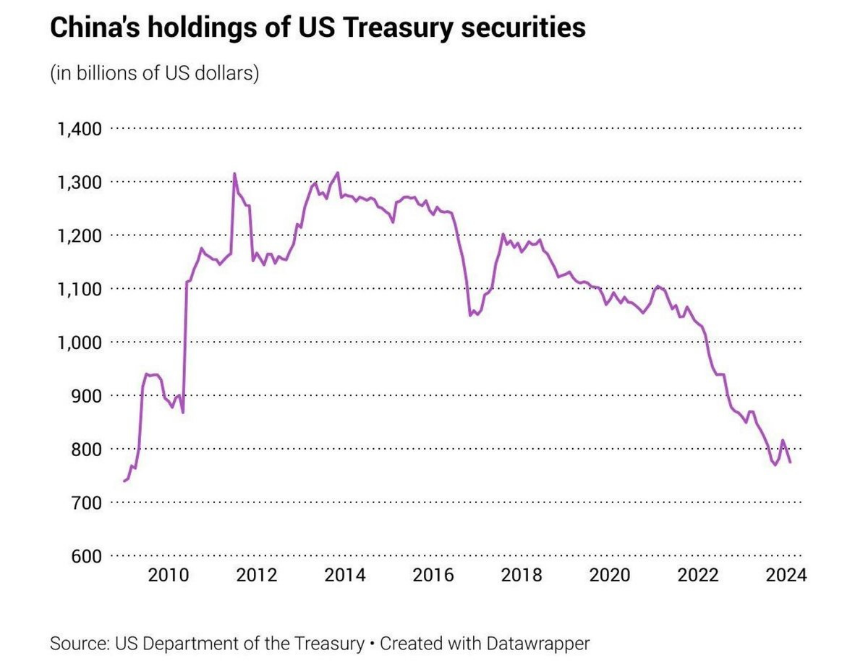
2. China reducing US treasury holdings: The second point to note is the sell off of US treasury securities by the Chinese central bank. The dollar value of its holdings has dropped by about 40% over the past ten years. Anecdotally, this trend is happening across central banks. And now, with rates expected to go up, even private investors do not want to hold on to long term US treasuries.
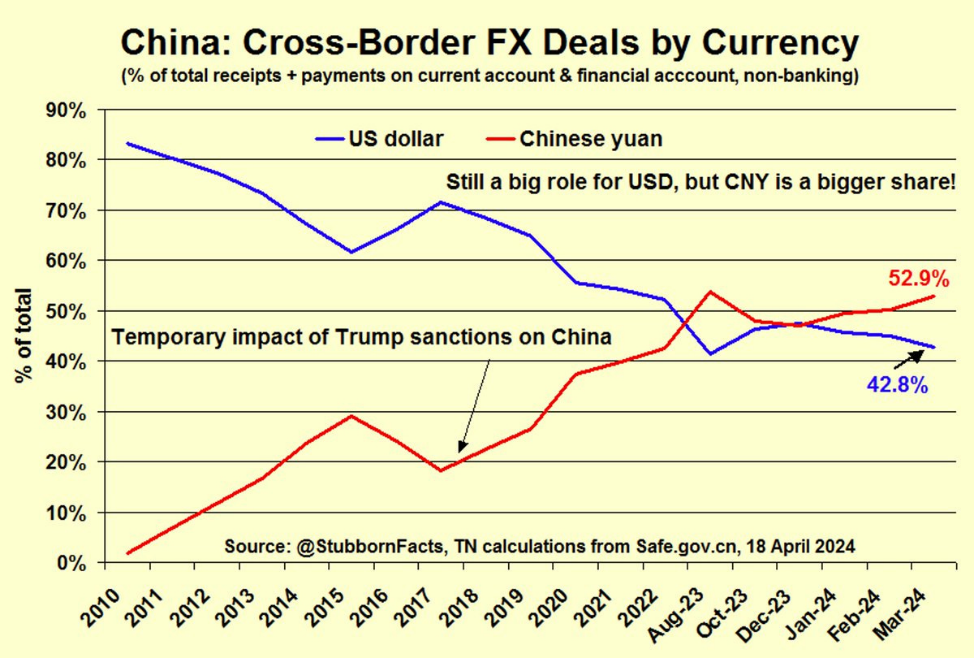
3. Increasingly, global trade is being done in non-USD currencies: The final point on this front is the increasing movement of cross border FX trades away from the USD. In 2024, more than 50% of China’s cross border FX trades were in RMB (see. This is bypassing the US financial system. This will accelerate if the US puts up more isolationist barriers around itself and the world learns to trade around the US rather than with the US.
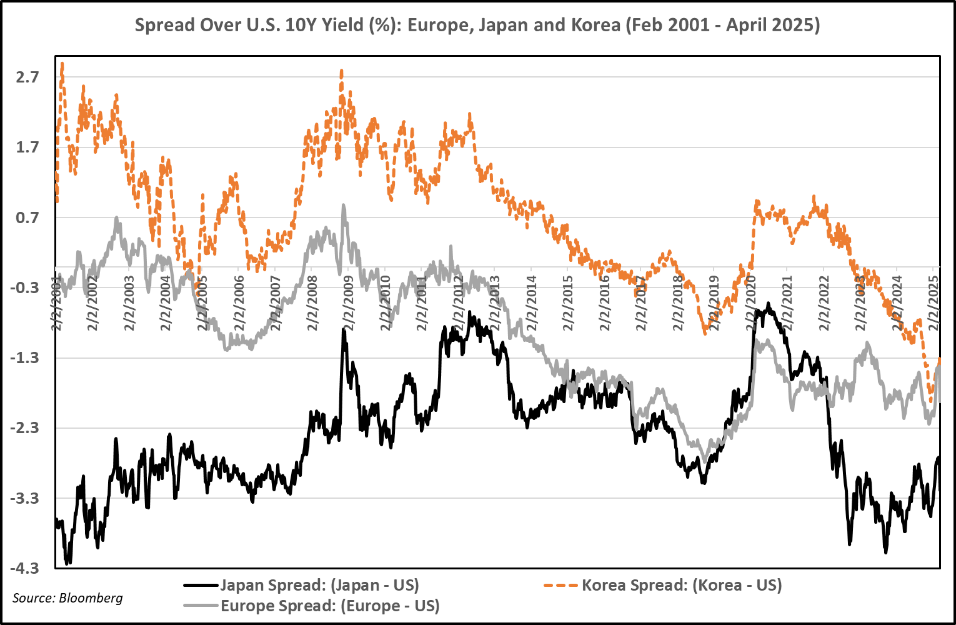
4. Borrowing cost for the rest of the world is becoming cheaper relative to the borrowing cost of the US: For most large markets, the cost of borrow spread over the USD cost of borrow has come down. For example, for most of the period from 2011 to 2021 the Chinese govt 10 yr yield was about 1.5-2% higher than the US 10 yr yield. Now it is at 3% below the US 10 yr yield. Similarly, the Indian yield has dropped from about 6% to only 2.4% now. So is the case for markets like Indonesia, Malaysia and Thailand. Even developed markets like Korea and Japan have seen the spread move by 2-3%.
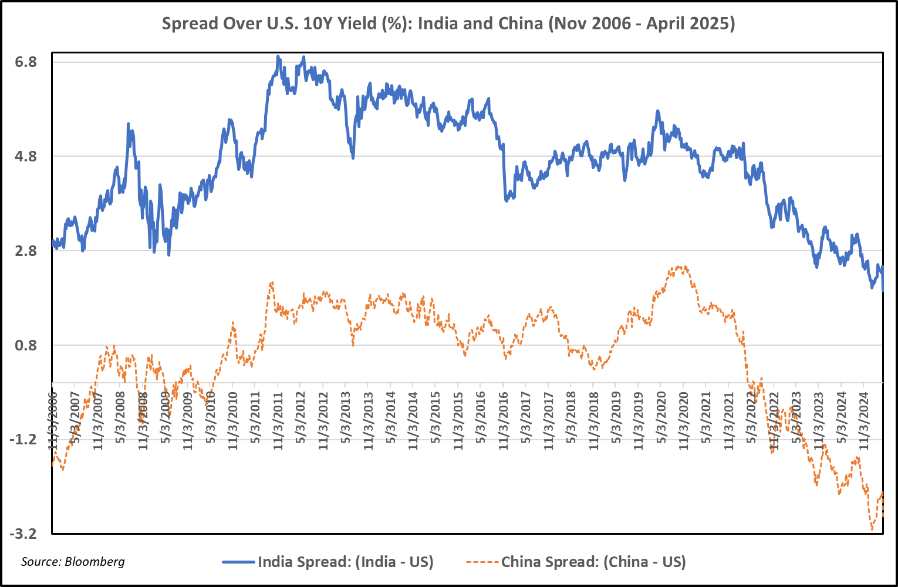
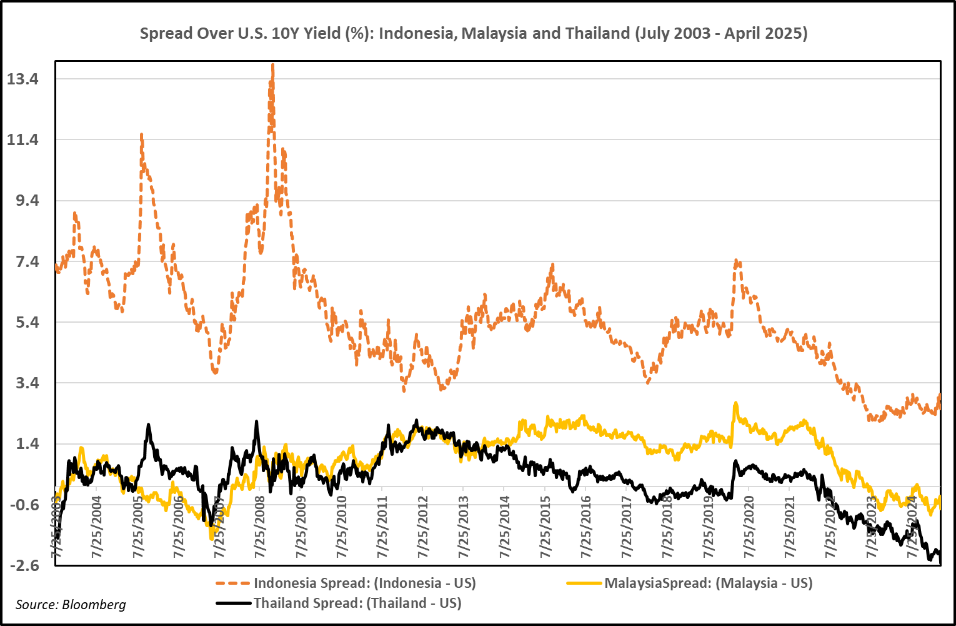
The prime implication of this is that the world thinks the US has become riskier on a relative basis. This, going forward, might reflect in higher risk premiums for US assets and, hence, a lower PE for the overall US market.
Conclusion
There is a slow but clear regime change happening. The dominance of the dollar is slowly weakening. Also, the US debt burden has become too large to ignore. The establishment in the US is aware of this and they have started the arduous task of this debt reduction. The current trade deficit rebalancing is part of this larger purpose. This process will be slow but purposeful and will have a generational change in the structure of global economic and financial interconnections. Our conclusion is that there is a high likelihood of the relative market performance of the 2000-2010 period repeating itself. This was when US markets gave zero returns while the rest of the world (especially EM) gave a double-digit compounding.
End
Disclaimer
This material is not intended as an offer or solicitation for the purchase or sale of any financial instrument. Information has been obtained from sources believed to be reliable. However, neither its accuracy and completeness, nor the opinions based thereon are guaranteed. Opinions and estimates constitute our judgement as of the date of this material and are subject to change without notice. Past performance is not indicative of future results. This information is directed at accredited investors and institutional investors only.