In the US, we have recently had the sharpest interest rate rises in history, both in magnitude and speed, but the actual economic impact has been muted at best. This is in spite of overall leverage at the country level being at historic highs. So, what are we missing?
The answer probably is in the similarity this situation has to the innovation effect. Historically, the perceptions of the impact of all large innovations have something in common. In the short run, the impact of the innovation is highly over estimated but the long-term impact is always highly under estimated. This is potentially what is happening as far as the impact of this paradigm rise in rates is concerned. We have yet to see the impact and we expect it is going to be more disruptive than we realise.
The Psychology Of Innovation
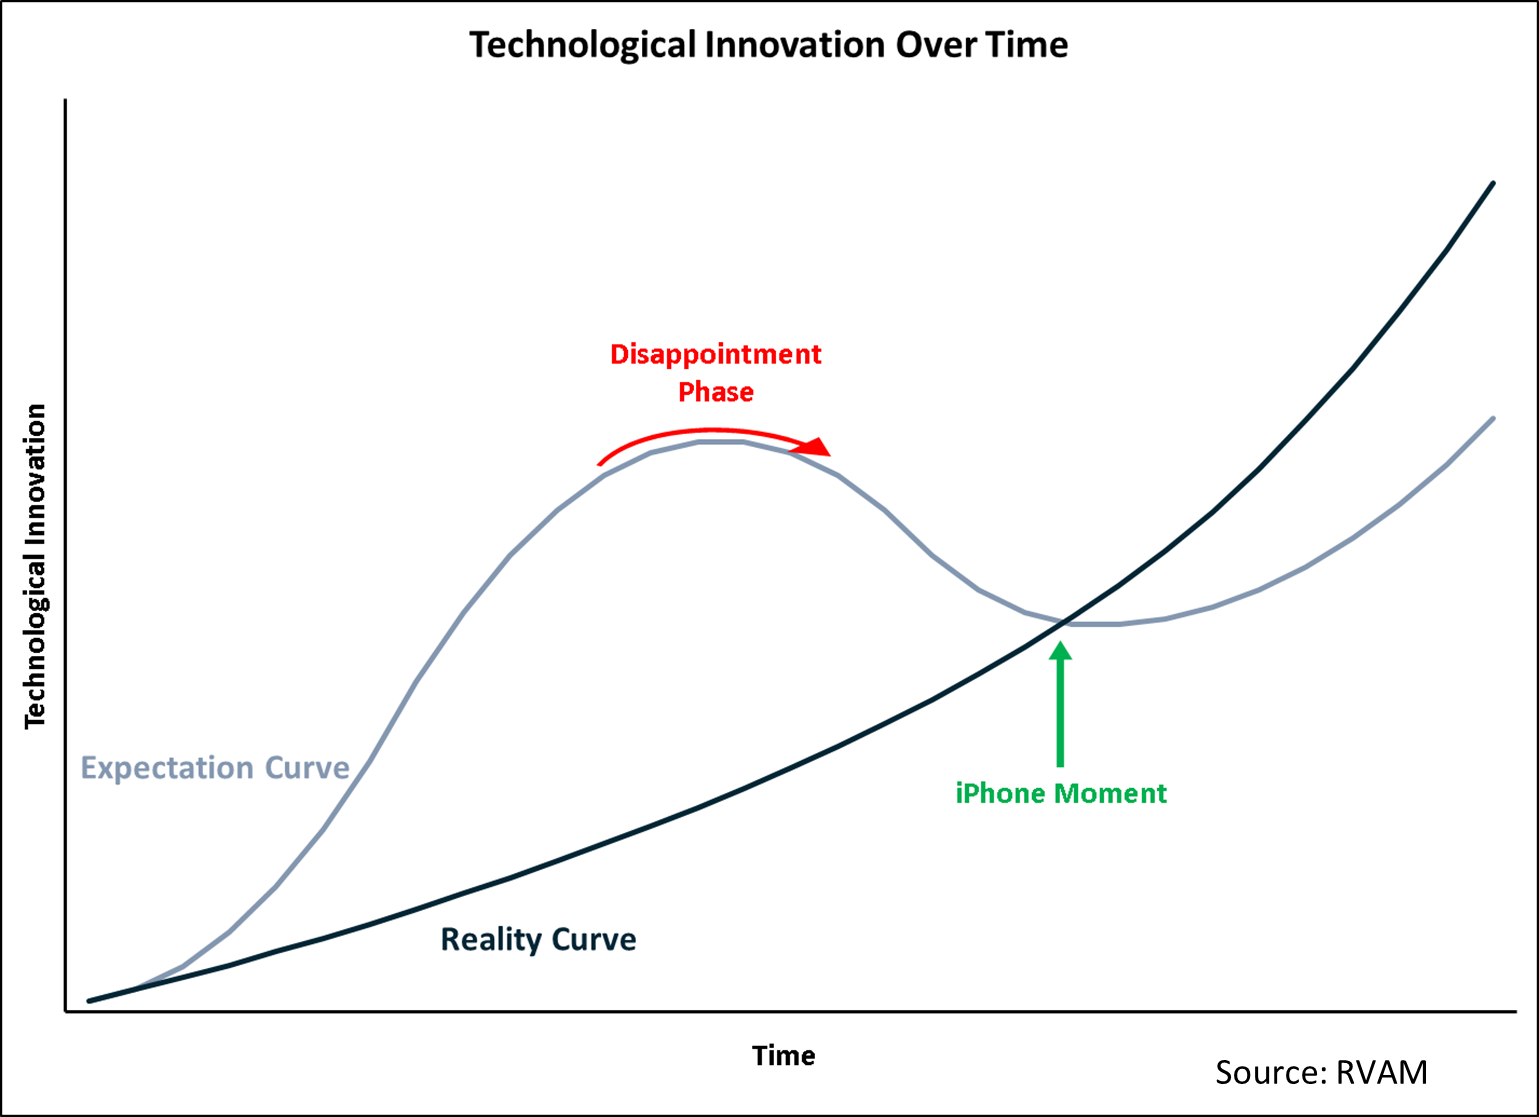
The impacts of all large innovations tend to be highly over exaggerated in the short term. On the other hand, the actual long-term impact tends to be a lot more than imagined. This is shown in the chart alongside. The inflection point is what is known as the “iPhone moment”, when the impact tends to exponentially overshoot into unimaginable territory. One result of the “iPhone moment” as far as the handphone revolution is concerned is the fact that an average American who spent 2.7 hours a day on a screen in 2008 spent 8.1 hours a day on a screen in 2021. The point is that even the greatest optimist on handphones when they came out in the early 1990s could not have imagined that Americans would spend half their waking hours in front of a device within thirty years.
Another oft cited example is the comparison of the processing power of the Apollo 11 spaceship (the first moon landing) with the processing power of modern day-to-day gadgets. The Apollo spaceship had the ability to process 85 instructions per second and it had 4 Kb RAM and 72 Kb RoM. This would be less than the processing power of a very basic pocket calculator – the type one could buy online now for about USD 10. Even the most optimistic of the tech evangelists of the late 1960s could not have imagined this level of progress.
On the other hand, even the most pessimistic tech sceptics might not have projected that it would take over twenty years after Apollo for any commercially viable mass market use of this technology to start showing up in society. Remember, the first viable home computers only started showing up in the early 1980s and some version of mass adoption started only by about 1990.
Our belief is that the impact of the interest rate reset will be similar – it will be large, but with a lag. Note that this reset into a band not seen for the last few decades is unprecedented and, in a way, similar to a disruptive technology. The lag could be 2-5 years, which means the first level impact is already starting to show up. However, a more fundamental change in the way we look at investments and asset pricing could take 3-5 years
Duration Delays The Impact Of Rate Rises
The primary reason that the rate increase of the past twenty months has not slowed the US economy much is duration. This means that the borrowers are still locked into lower rates and the reset is only happening slowly.
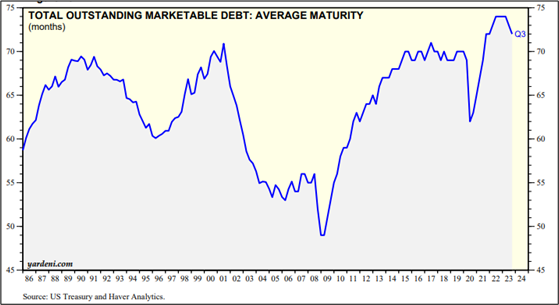
The primary borrower in the US is the government. Here, the average duration has shot up from about 5+ years in 2020 to about 6 years in early 2022. The US government clearly took advantage of the low rates post-COVID to borrow long term.
This is helping to postpone the impact of high rates on the US government borrowings. But this number will change fast. About 31% of the US outstanding debt is expected to mature in the next one year. Some of this is short term debt which has already gone up in the past 12-18 months, but some is low-cost long-term debt which will price up sharply.
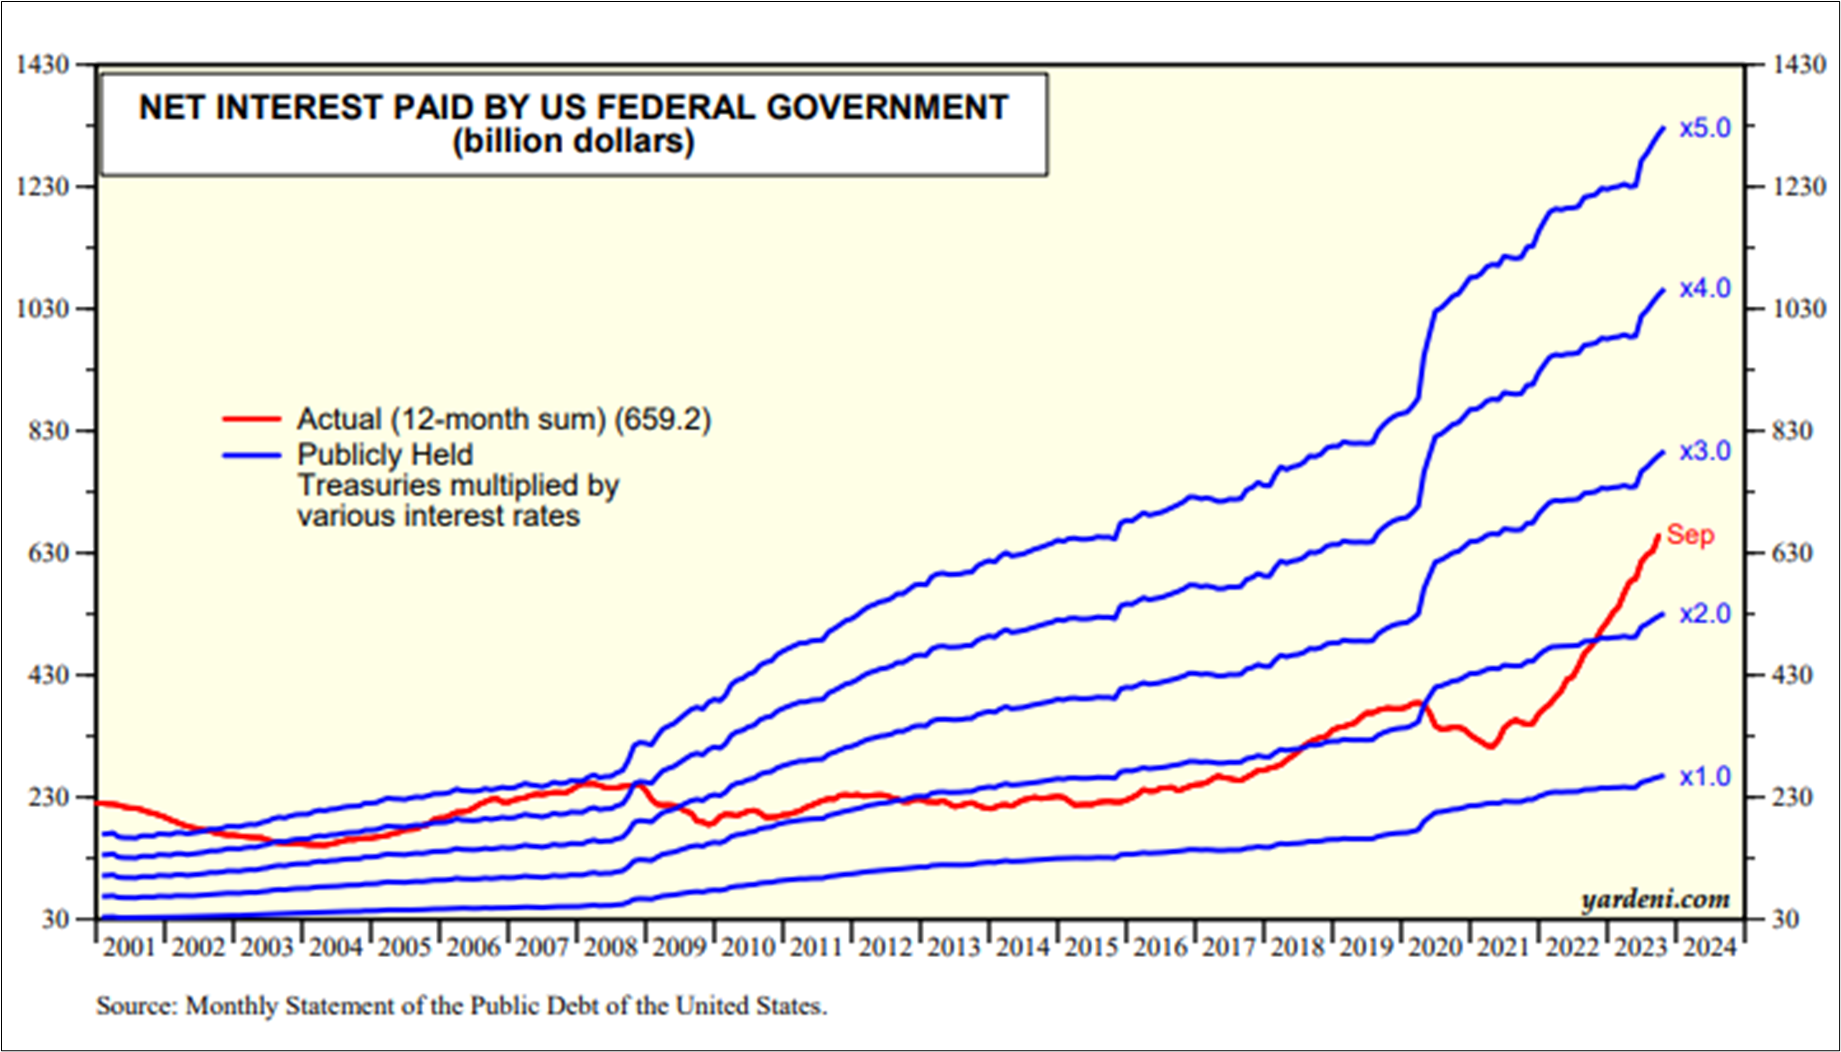
Consequently, the debt burden on the US exchequer is expected to keep moving up. Currently, the average cost on the USD 26 trln. of US government borrowing is about 2.5%. This is shockingly low given the fact that the cost of fresh borrowing for the US government is between 4.6-5.5% (depending on the duration). The current total interest cost of US 660 bln. p.a. would double to over USD 1.3 trln. if the average interest rate were reset to the current rate. This throws light on the numeric implications of the term “higher for longer”. Long term rates reaching 5% for 12-18 months has a much milder implication compared to them staying there for 5-6 years.
Rate Rise Happening In An Environment Of High Government Debt
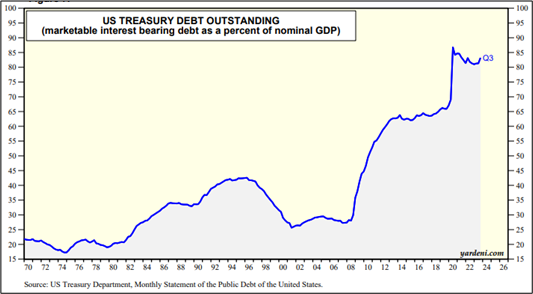
US government debt has risen dramatically since 2008, in two spurts of 2008-12 and 2020-21. Currently, at about 85% of GDP, it is way above the 25-30% level of 2007. So, a rising rate impact is going to happen in an environment of a very high debt level. The disruption will be painful.
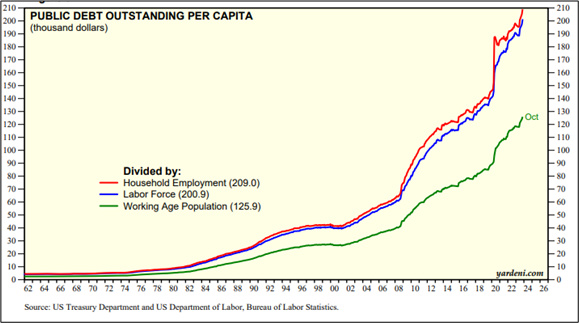
In the US, the averge public debt per household is over USD 200,000 (this does not include the direct household debt). This is huge, considering the fact that the average savings per household in the US is only USD 62,000. Also, this number has shot up from USD 50,000 in 2007 to the USD 200,000 number now. Remember, finally all government debt has to be repaid by households or corporates in the form of taxes.
Household Debt is Rising But Is Still Relatively Low
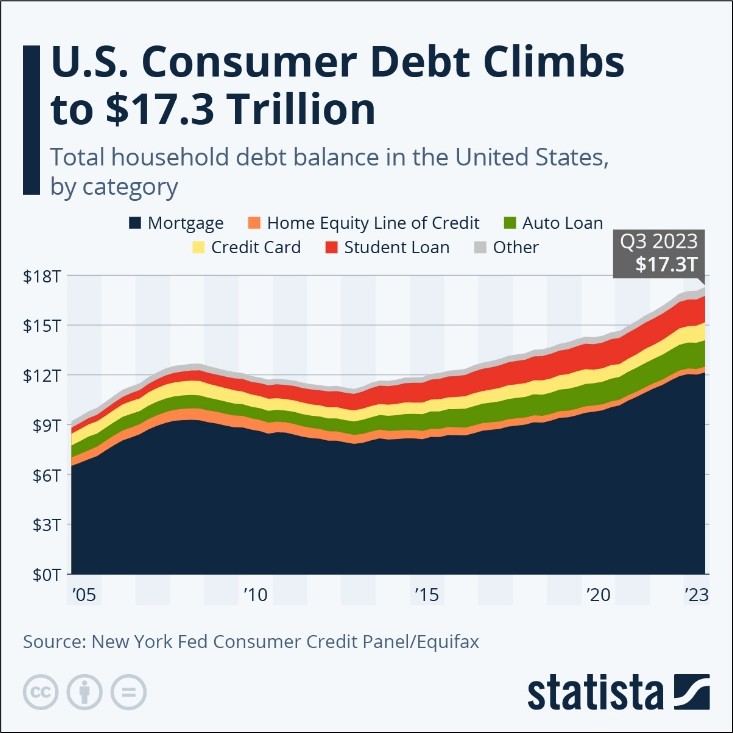
US household debt went down post the 2008 crisis and bottomed in absolute terms in 2013. Since then, it has grown by 50%, in line with the GDP. The cost of this will only slowly get priced up as nearly two-thirds of this is mortgage debt with a very high duration.
Though the total debt has not gone up dramatically, the debt mix has worsened. Housing debt, which tends to be longer duration and fixed, has moved up by only 20% from 2013 to now. But unsecured debt (credit card, student loans and auto) has more than doubled from USD 2.5 trln. in 2013 to over USD 5 trln. now. This debt gets priced up very quickly and has much higher cost. Hence, this could be the source of initial distress on the household front.
Corporate Bankruptcies Moving Up
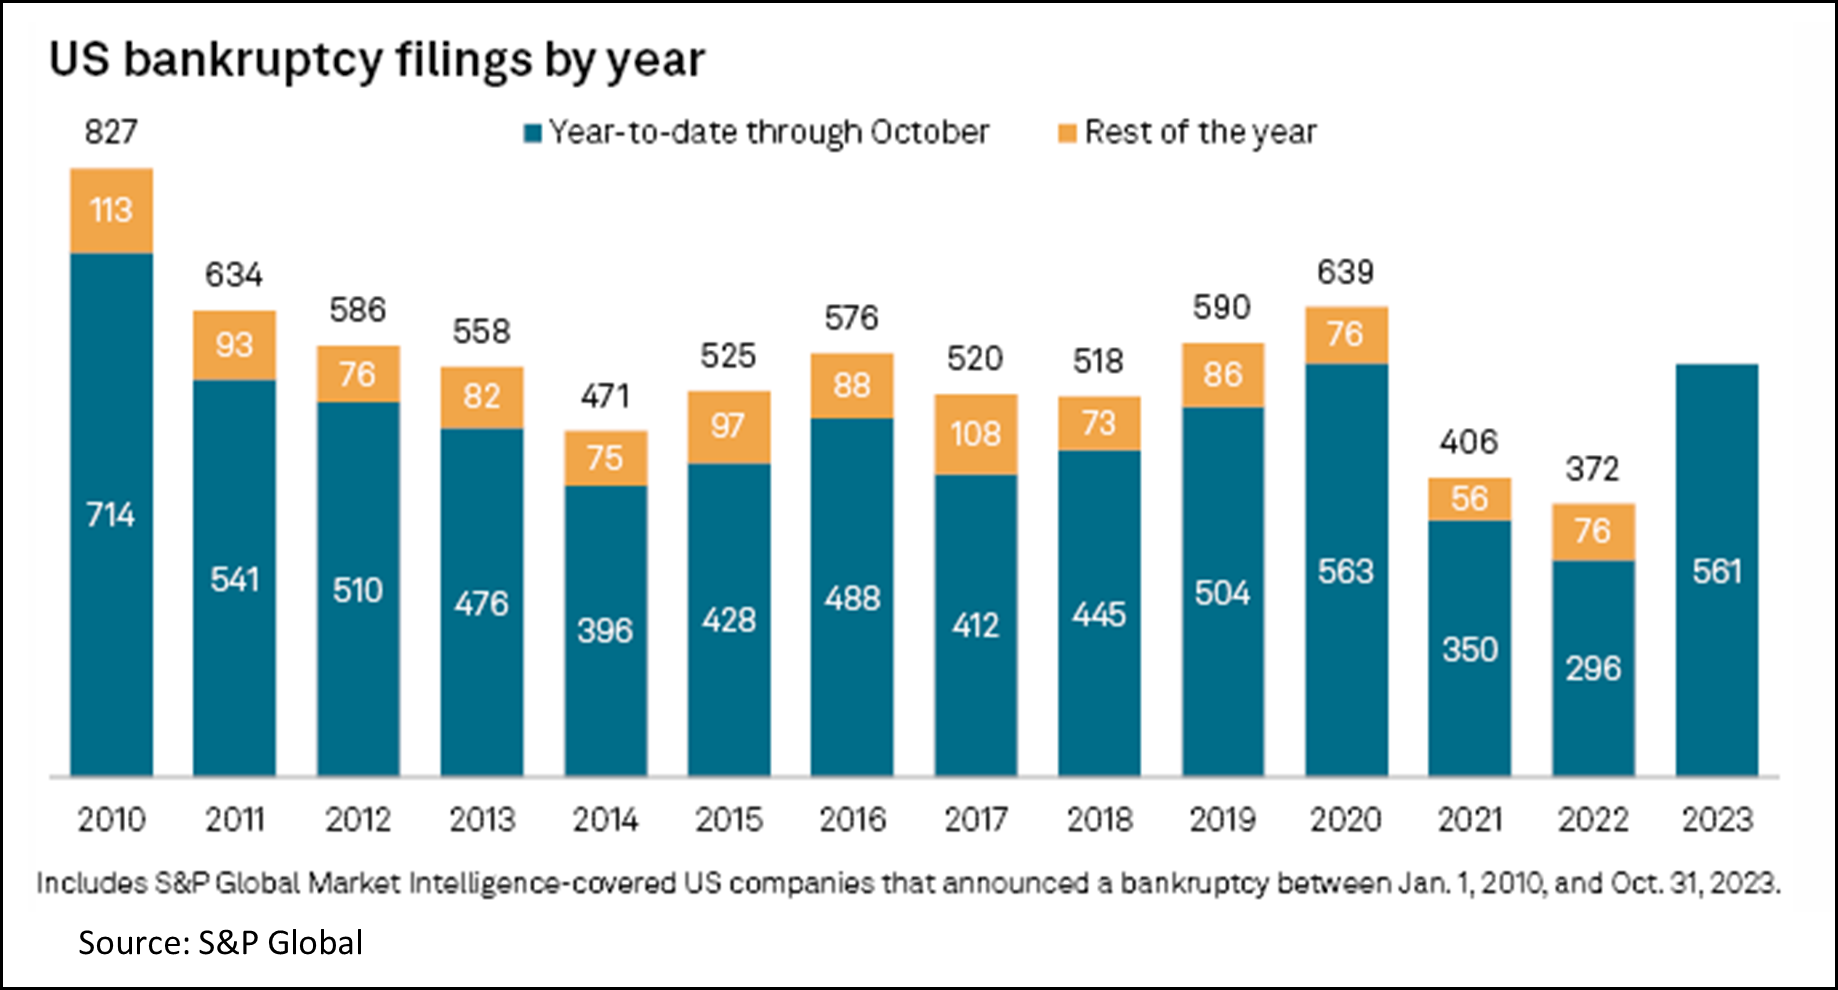
US corporates overall have not levered up to the same extent as the government, with total corporate debt remaining at about 75% of GDP since 2007. On the other hand, the aggregate numbers hide the underlying trend. The US has some very large, very cash rich companies, which makes the overall debt situation seem more moderate than it actually is. Hence, another way to look at the stress from leverage and rising rates is to look at bankruptcy filings.
Here, the S&P data which highlights the bankruptcy filings from within its covered companies is useful. The 2023 ytd numbers are now the same as in 2020. Given current trends, 2023 could have the highest bankruptcy numbers since 2010.
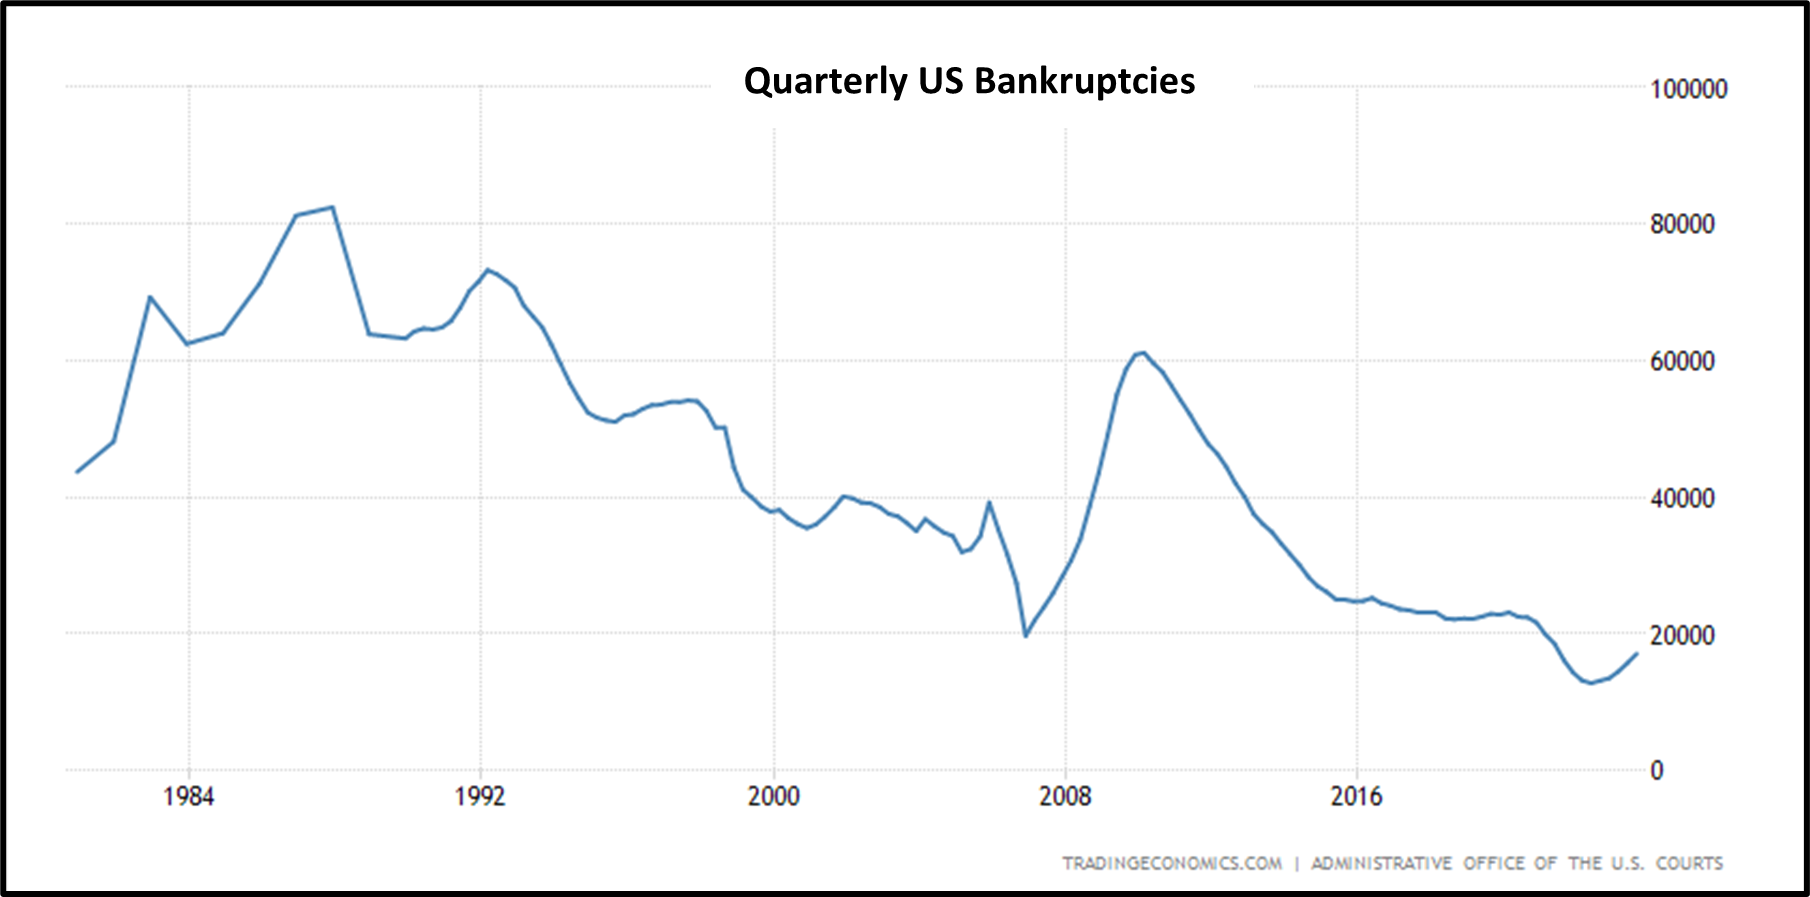
A broader view is not as bad, as the smaller unlisted companies have been more cautious since 2008. Here, though the numbers have sharply risen since early 2022, they are quite low by historic standards. US quarterly bankruptcy filings were about 17k in Q3 2003. This has risen from a low of 12.7k in Q2 2022 but is much below the high of over 80k in 1987.
Conclusion
Like the impact from disruptive innovation, the impact from permanently higher interest rates will creep in slowly before it sprints up. This will be a disruptively high transfer of wealth from the lenders to the borrowers. The two largest lenders in America are foreign investors and corporate America. The largest borrower is the US government, followed by US households.
There are some obvious ways out of this. The first is tolerating a higher inflation for longer, which will help the government to grow out of the debt. The second is potentially higher corporate taxation to transfer back the surplus from the lender (corporates) to the borrower (borrower).
Whichever way this rebalancing pans out, the disruption will be high. Combine this change in cash flow with higher discount rates and we will have a large impact on asset prices. We hope to incorporate that into our calculations and portfolio construction going forward.
Cover image by Gerd Altmann from Pixabay
End
Disclaimer
This material is not intended as an offer or solicitation for the purchase or sale of any financial instrument. Information has been obtained from sources believed to be reliable. However, neither its accuracy and completeness, nor the opinions based thereon are guaranteed. Opinions and estimates constitute our judgement as of the date of this material and are subject to change without notice. Past performance is not indicative of future results. This information is directed at accredited investors and institutional investors only.