
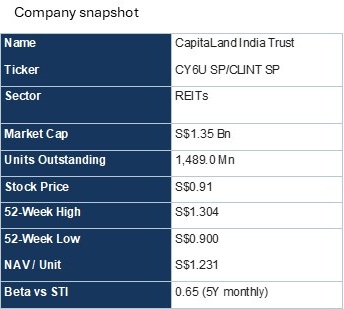
This quarter we write in detail about one of our conviction stock ideas. This is a play on the broad sell-off in assets related to the strong run up in long term USD risk free rates. This hits certain currencies (like the INR) and certain kinds of assets (like Reits). We are writing about possibly the best quality India-centric Reit (though listed in SGD), CapitaLand India Trust. This stock seems to be sitting on a very skewed risk-return curve with relatively low downside and an option for strong upside.
CapitaLand India Trust (CLINT) CY6U
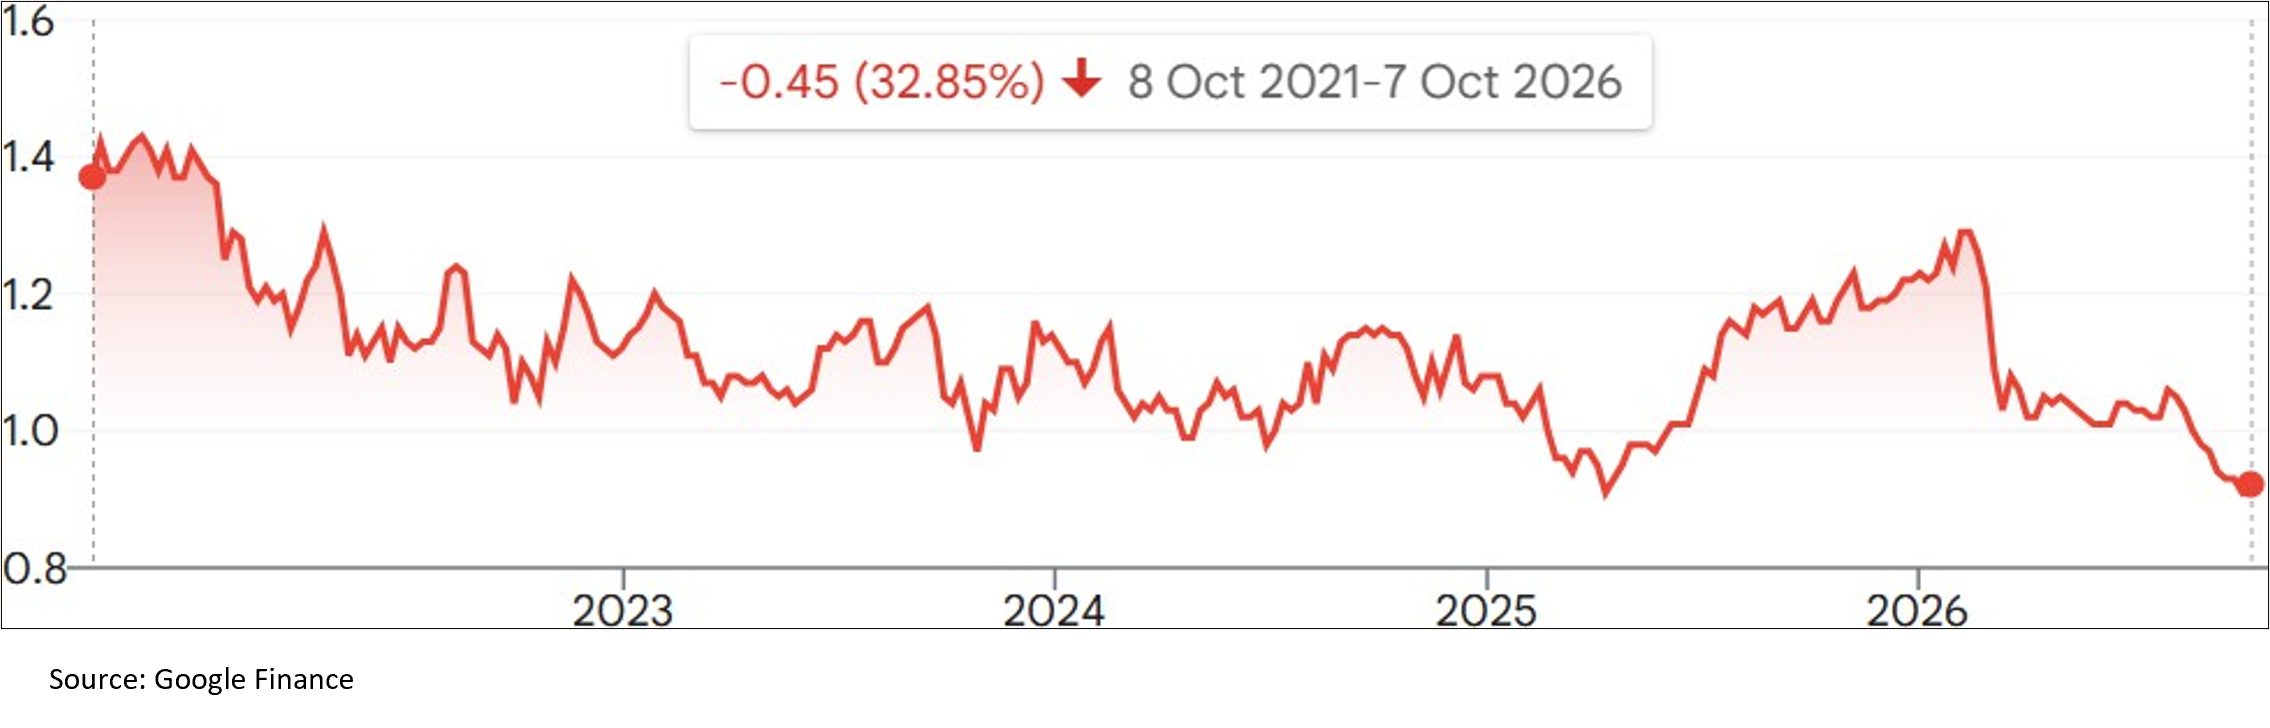
5YR Stock Price Chart
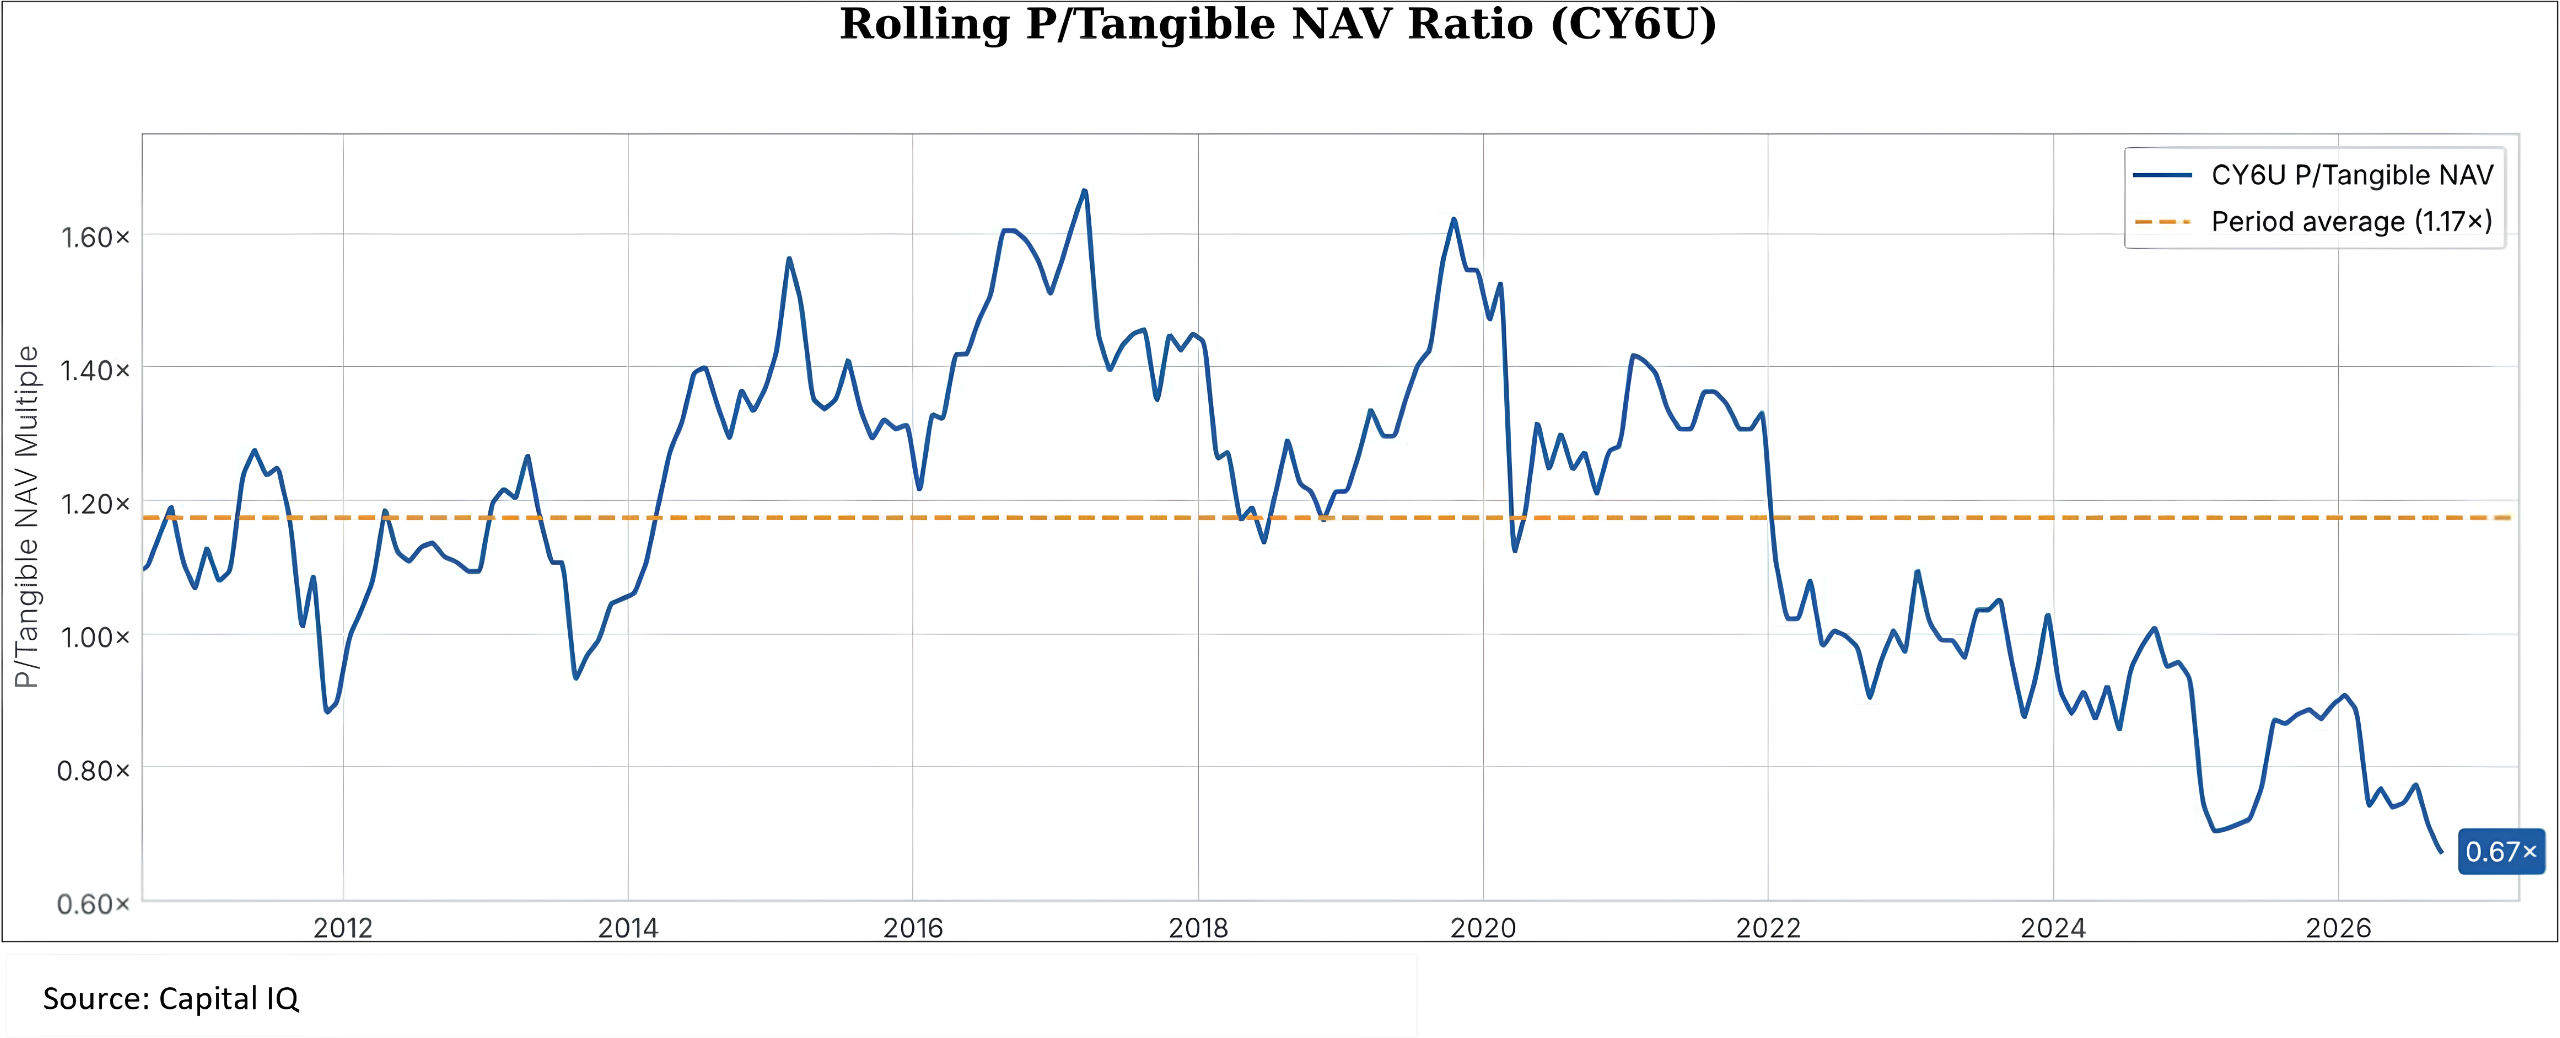
Valuation Chart
Investment Thesis
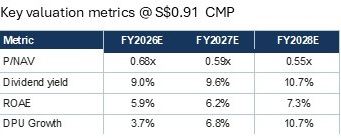
- Compelling valuation at a historical trough: CLINT is a Grade A office/ commercial landlord and developer with 90%+ portfolio occupancy across cycles, including through COVID-19, yet is trading at approximately 0.67x TTM P/NAV and a 9% TTM distribution yield, close to 15-year valuation lows. The derating has been driven largely by sharp SGD/INR depreciation over the past few years and the rise in global bond yields. At current levels, the valuation offers an attractive risk/reward, particularly with DPU and NAV expected to grow by around 20% and 25%, respectively, over the medium term.
- Data centres provide a visible step-up in earnings: CLINT’s four data centre developments represent 200 MW of gross power capacity and are expected to generate 11–11.5% NPI (net property income) yields once fully stabilised. At full operation and leasing (by about 2028), they could contribute roughly 20-22% of current total property income, creating meaningful earnings and DPU accretion over the next two years. With a substantial portion of development capex already incurred and income only beginning to ramp up, current valuations appear to assign limited credit to the future data centre earnings stream.
- Strong embedded asset growth through committed pipeline: Excluding data centres, CLINT expects its office and industrial portfolio to expand from approximately 22m sq ft currently to 31m sq ft by 2030, implying 6-7% annual GFA/AUM growth. A sizeable portion of this expansion is supported by committed forward purchases, providing greater visibility than purely opportunistic acquisitions.
- Rental growth provides an additional organic earnings lever: Alongside portfolio expansion, CLINT benefits from 2-3% annual underlying rental growth, while recent lease renewals have achieved significantly stronger 15-20% rental revisions (over a 3-4-year renewal cycle).
- INR depreciation could take a medium-term breather: The INR depreciation has accelerated to over 7.5% p.a. over the past 2 years – this is much above the 4% p.a. 25-30-year trend line. Historically this has been followed by a few years of a benign depreciation. This could be good for SGD returns.
The combination of asset additions, positive rental escalation and data centre stabilization creates the potential for a materially stronger phase of NPI and DPU compounding over the medium term. Combine this with a steadier INR, and we get potentially strong SGD returns.
Business Description
| Asset category | Description | Role |
| IT/ Business Parks | Large office campuses across Bengaluru, Hyderabad, Chennai, Pune and other major cities | Core earnings base and majority of current NPI |
| Industrial / Logistics | Warehouses and industrial facilities | Smaller diversification component |
| Data Centres | Navi Mumbai, Hyderabad and Chennai; four major facilities including two Mumbai towers | New growth vertical with capital invested ahead of full income contribution |
The business park portfolio is the dominant source of current earnings. Data centres have already become meaningful from an asset value perspective, but are only beginning to contribute to income. This creates an important distinction between CLINT’s current asset base and its current earnings base.
AUM by Asset Class and Geography
| 2020 | 2021 | 2022 | 2023 | 2024 | 2025 | |
| Portfolio occupancy | 94% | 87% | 92% | 93% | 92% | 91% |
| AUM or Portfolio Value (S$ bn) | 2.06 | 2.44 | 2.46 | 2.95 | 3.71 | 3.78 |
| IT Parks (% of AUM) | 94.6% | 93.6% | 86.5% | 86% | 80% | 77% |
| Industrial/ Logistics (% of AUM) | 5.4% | 5.4% | 8.4% | 8% | 5% | 3% |
| Data Centres (% of AUM) | 0.0% | 1.0% | 5.1% | 6% | 15% | 20% |
Source: Company filings
CLINT’s strategy has steadily shifted from simply owning stabilised office properties towards a build (directly or via developer loans), acquire, recycle and redeploy model. Capital is invested into developments and forward purchases (via construction loans to reputable developers). Once completed, the loans convert to purchase considerations to buy out these properties. The company also actively recycles capital into higher-return opportunities by selling mature and non-core assets.
AUM distribution by Geography in 2026
| Asset Class | Geography | % of Total AUM | % of AUM |
| Office/ Business Parks | Bengaluru | 27% | 77% |
| Hyderabad | 22% | ||
| Pune | 13% | ||
| Chennai | 10% | ||
| Mumbai | 5% | ||
| Industrial / Logistics | Mumbai/ Panvel | 3% | 3% |
| Data Centres | Navi Mumbai | 12% | 20% |
| Hyderabad | 5% | ||
| Chennai | 3% |
Source: Company filings
AUM increased from S$2.06bn in 2020 to S$3.78bn in 2025, an approximately 13% CAGR. The portfolio also diversified materially: IT parks declined from about 95% to 77% of AUM, while data centres increased from almost nil to about 20%. The sharpest asset-base expansion occurred in 2023-24 as acquisitions, developments and data centre construction were added to the portfolio.
The limited SGD AUM growth in 2025 understates the underlying INR asset appreciation. Portfolio value increased by roughly 15% in INR terms, but the INR weakened materially against the SGD, offsetting most of the increase on translation.
Portfolio Expansion and Funding Model
CLINT distributes around 90% of its distributable income, so only a limited portion of internally-generated cash is retained for growth. As a result, new investments are funded through a combination of debt, periodic equity or perpetual issuance, retained cash and proceeds from asset recycling. Mature or non-core properties can be sold and the proceeds redeployed into new developments or acquisitions, allowing CLINT to recycle capital rather than relying solely on fresh equity.
CLINT expands its portfolio in the following ways:
- Acquisition of completed properties
CLINT acquires already completed and largely stabilised assets from its sponsor or third parties. These acquisitions can begin contributing rental income and NPI shortly after completion of the transaction.
- Forward purchases
CLINT commits to acquire an asset that is still under development by a third-party developer. During the construction period, CLINT typically advances capital as interest-bearing development funding/ receivables, allowing it to earn income before ownership transfers. Once the asset is completed and agreed conditions are met, CLINT pays the remaining consideration and acquires the completed property or project company, after which returns shift from interest income to rental/ NPI.
- Self-development of assets
CLINT also develops assets directly, either by adding new buildings within existing business parks or by developing new asset classes such as data centres. In these cases, CLINT funds the development capex itself and retains the full economics of the asset once it becomes operational and stabilized
Investment Case
| 2020 | 2021 | 2022 | 2023 | 2024 | 2025 | 2026E | 2027E | 2028E | |
| AUM (S$ bn) | 2.06 | 2.44 | 2.46 | 2.95 | 3.71 | 3.78 | 3.55 | 3.75 | 4.00 |
| NAV (S$ bn) | 1.24 | 1.36 | 1.29 | 1.54 | 1.86 | 1.87 | 1.98 | 2.2 | 2.32 |
| NAV/ Unit (S$) | 1.08 | 1.18 | 1.11 | 1.16 | 1.38 | 1.38 | 1.38 | 1.52 | 1.63 |
| Growth YoY in NAV/ Unit | 9% | -6% | 5% | 19% | 0% | 1% | 10% | 7% | |
| DPU (S$ cents) | 8.83 | 7.80 | 8.19 | 6.45 | 6.84 | 7.87 | 8.20 | 8.70 | 9.70 |
| Growth YoY in DPU | -12% | 5% | -21% | 6% | 15% | 4% | 6% | 11% | |
| SGD/ INR | 55.3 | 55.1 | 61.3 | 61.6 | 62.7 | 70.4 | 74.9 | ||
| 11.3% | 0.5% | 1.8% | 12.3% | 6.4% |
Source: Company filings
For a REIT, the key metrics to track are NAV per unit and DPU growth, rather than absolute AUM growth, as externally managed REITs can grow AUM at the expense of unitholders through yield-dilutive acquisitions or equity issuance below NAV. CLINT has largely avoided this. From 2024-26, NAV growth flattened out because of a sharp INR depreciation of about 20%.
DPU inflection – 23% growth through 2028E, implying 7% CAGR: CLINT is entering a period where earnings growth should translate more directly into per-unit distributions. The key drivers are the conversion of forward-purchase assets into income-producing properties, with strong rental revisions across the existing portfolio. Together, these drivers support DPU growth from 7.9 cents in 2025 to 9.7 cents by 2028E, marking a clear inflection from the relatively stagnant DPU of the past few years.
Data centres provide a significant earnings and NAV uplift: CLINT’s four data centre developments are expected to generate 11.5-12% NPI yields on development cost once fully operational and leased. Two of the four facilities – the Navi Mumbai towers – have already been fully leased to a leading global Hyperscaler, providing strong visibility on future income contribution. At full stabilisation by 2028, the data centre portfolio could contribute property income equivalent to roughly 20-22% of CLINT’s current total property income, making it a meaningful vertical for new earnings.
CLINT also sold a 20.2% stake in three data centres to the CapitaLand India Data Centre Fund at 2.7x invested capital, demonstrating significant value creation above development cost. As the remaining capacity is leased and stabilised, this creates potential for further fair-value gains and NAV uplift. In addition, CLINT secured participation rights, but not an obligation, of up to 33% in future sponsor-led data centre developments in India, giving it access to CapitaLand’s broader data centre pipeline and operating expertise without having to originate every project independently.
40% increase in GFA and strong rental escalations: CLINT’s office and industrial portfolio is expected to grow from approximately 21.7m sq ft today to 30.9m sq ft by 2030, driven by around 7.3m sq ft of forward purchases and 1.9m sq ft of additional IT-building developments. On top of this physical expansion, the existing portfolio should continue to benefit from 2-3% annual underlying rental escalation, while recent lease renewals have achieved 15-20% rental revisions on expiring leases. The combination of a materially larger portfolio and higher rent per sq ft provides a visible multi-year earnings runway, with property income capable of growing faster than floor area alone as new assets stabilise and rents reset higher.
4% DPU accretion from onshoring 40-50% of debt: Historically, a large portion of CLINT’s debt has been raised in SGD, with part of this exposure swapped back into INR. Although the swaps reduce currency mismatch, the borrowing remains structurally offshore and creates two tax inefficiencies in India. First, interest on offshore related-party debt is deductible only up to 30% of EBITDA, so interest above this limit does not reduce taxable income. Second, interest remitted from India to offshore lenders is subject to withholding tax, creating an additional cash leakage. By replacing offshore SGD debt with onshore INR borrowing, CLINT removes much of this tax friction while also creating a natural hedge between INR assets, rental income and debt. This creates additional distributable income and about 4% DPU accretion. Management intends to increase onshore debt to around 40-50% of total borrowings over time.
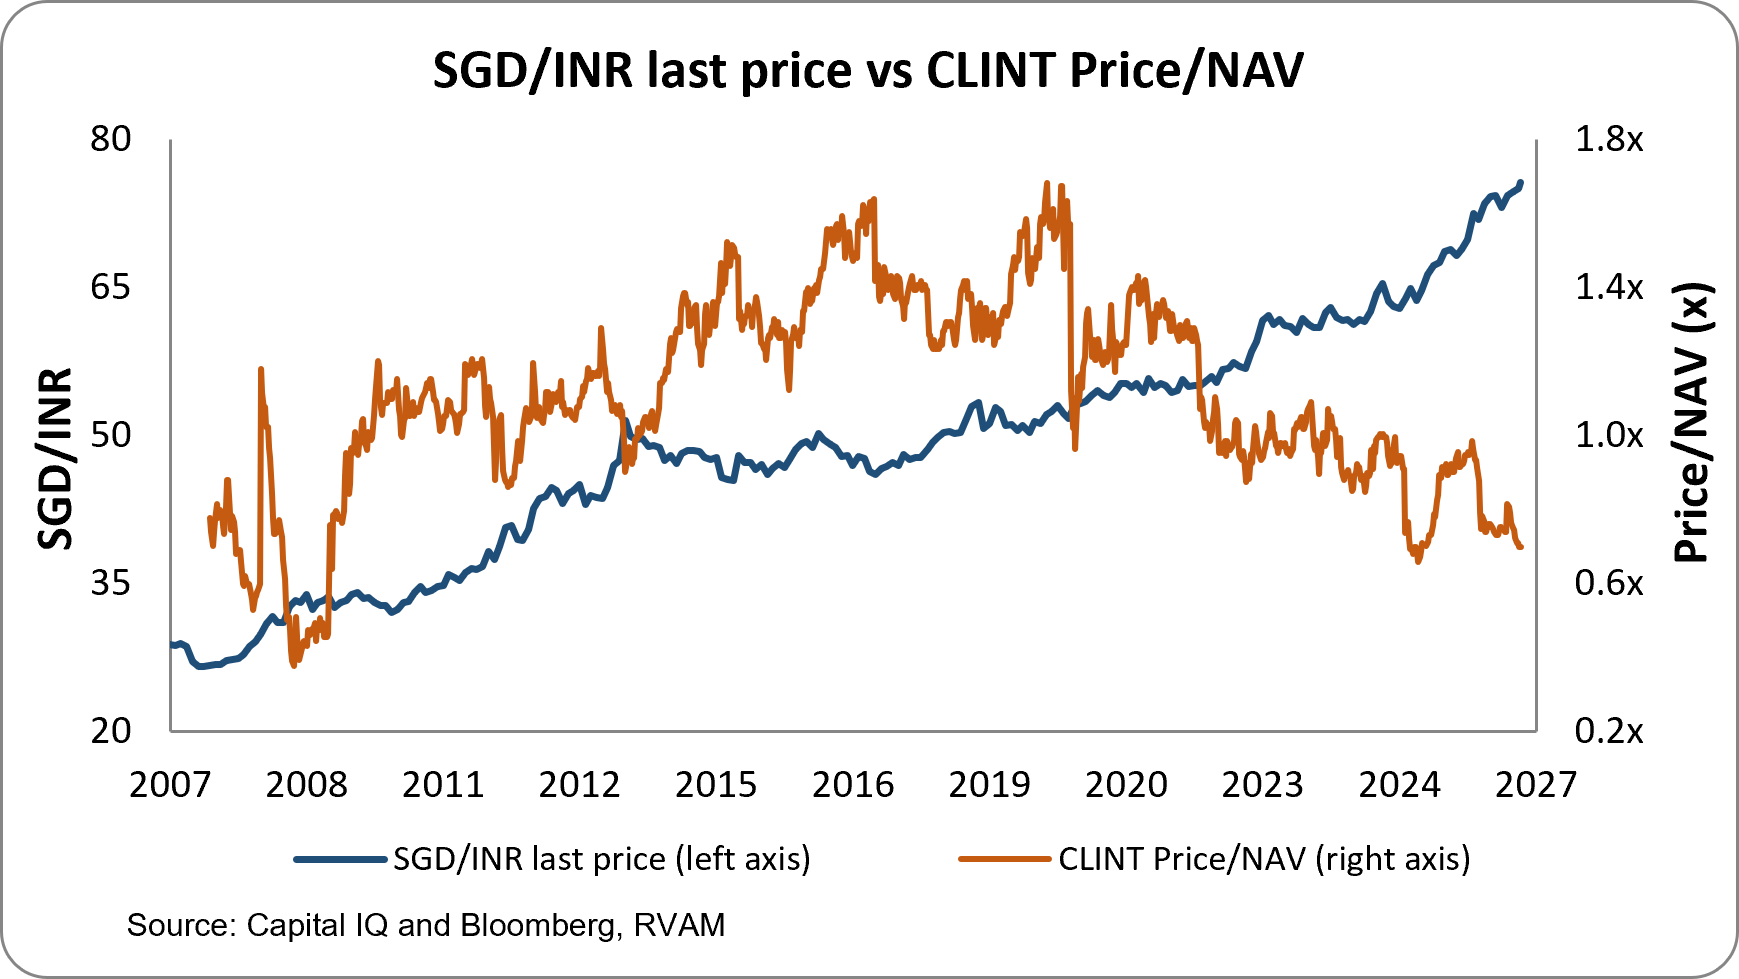
INR normalisation could drive a meaningful valuation re-rating: As shown in the chart alongside, periods of sharp INR depreciation against the SGD(2020-2026) have coincided with significant de-rating in CLINT’s P/NAV, with the recent acceleration in INR weakness contributing to the stock falling towards historically low valuations of around 0.6-0.7x P/NAV. Conversely, when the currency trend became more benign, valuation recovered strongly. Between 2012 and 2019, as SGD/INR remained relatively stable, CLINT re-rated from around 1.0x to as high as 1.6x P/NAV. A period of normalisation in the SGD/INR currency pair could therefore provide a meaningful re-rating catalyst, particularly as underlying DPU growth becomes more visible.
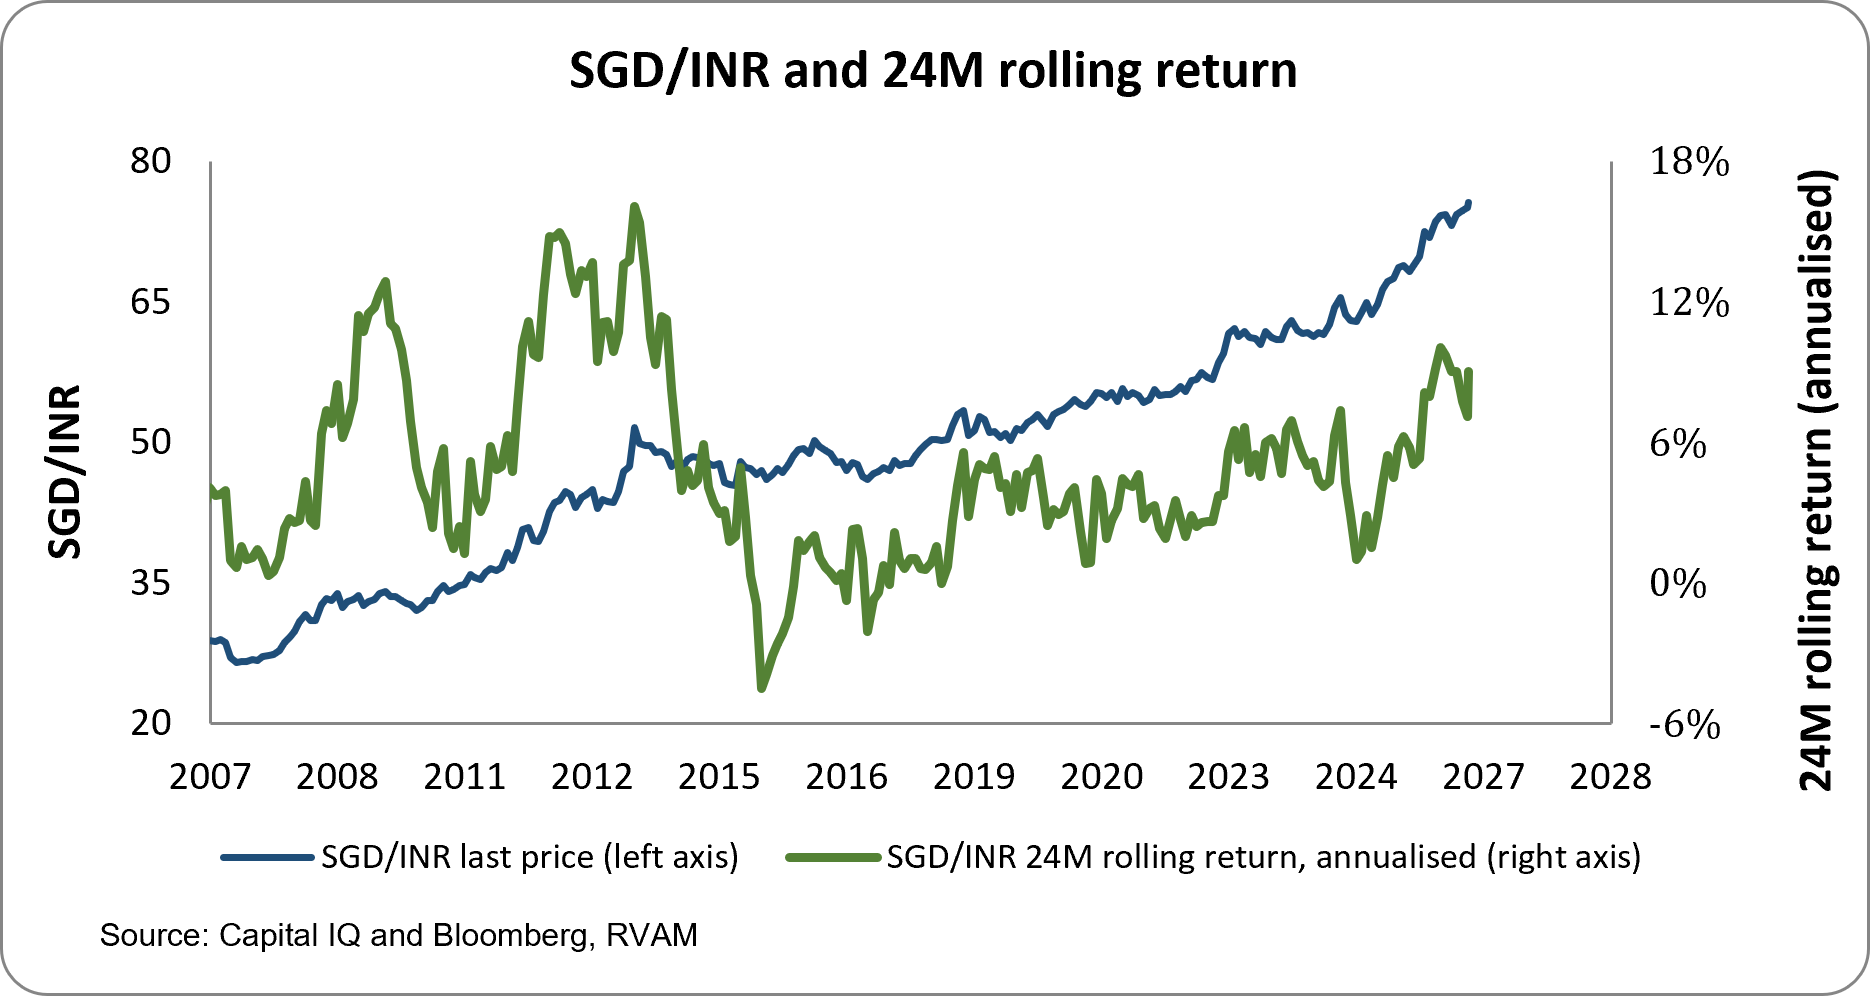
INR headwind could turn more benign in the medium term: The Indian rupee has seen a perfect storm in the past 2-3 years, especially against the SGD. There is a strong reversal-to-mean argument we are making here. While the long term (20-30 years) depreciation of the INR against the SGD is about 4-4.5% p.a. (depending on the time window taken), this rate has dramatically accelerated. In the past five years the INR has depreciated against the SGD at 6.4% p.a. and at 7.4% p.a. in the past two years. As shown in the chart alongside, the 24-month rolling annualised depreciation has also moved towards the upper end of its historical range, highlighting how unusually steep the recent depreciation cycle has been. Whenever this kind of strong divergence from the long-term trend line has happened, the INR depreciation has flattened out for a few years. We think we are going to see such a benign INR depreciation environment in the next few years. This will be great news for CLINT as then the full rupee growth will translate to an SGD growth.
AI is not necessarily a risk for grade A office property demand in India: The common fear is that the AI-led disruption will cause a large demand loss for India’s knowledge outsourcing industry. The evidence on the ground is otherwise. While the IT outsourcing giants need to restructure their demand for seats and space because of AI, the anti-immigration push in the US is leading to an acceleration of outsourcing demand from US companies. Also, the India GCCs of global companies are becoming the centres of AI implementation for these global companies. This has increased demand from GCCs too. Hence, the demand scare from AI for CapitaLand India’s assets might be unfounded.
In Summary
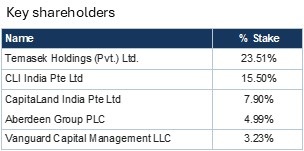
- 25-30% compounder through yield + re-rating: At the current S$0.91-unit price, CLINT trades at roughly 0.66-0.67x NAV despite improving earnings visibility. If the trust re-rates to 1.0x 2028E NAV of S$1.63, while paying approximately 26.6 cents of cumulative distributions through 2028, total value realised would be around S$1.90 per unit. This implies more than 100% total return from current levels, without assuming that CLINT trades at a premium to NAV.
- High-quality asset base provides downside support: CLINT’s Grade A office portfolio has maintained around 90%+ occupancy across cycles, including through COVID-19, while continuing to achieve positive rental reversions. This provides confidence that future earnings growth can come from stabilising and monetising assets already within the portfolio and committed pipeline, rather than relying on increasingly aggressive acquisitions.
- Rupee depreciation might be benign for the next few years: Based on history, this not only improves growth in SGD NAV and DPU, it also leads to a re-rating of the stock.
- GCC demand and stricter immigration rules in the US increase Grade A office space demand in India.
Overall, the risk-reward is attractive because the current valuation already discounts a significant amount of execution and currency risk, while successful delivery of the existing pipeline creates upside through both DPU growth and a potential narrowing of the discount to NAV.
Key Risks
SGD/ INR depreciation
CLINT earns property income mainly in INR but reports and distributes in SGD. Distribution hedges reduce near-term volatility but do not remove the long-term translation effect. 1H26 illustrates the risk clearly: NPI grew 6% in INR but fell 5% in SGD, while DPU grew 13% in INR but only 1% in SGD. As mentioned earlier, this headwind is tapering off but it remains a risk.
AI negatively affecting office occupancy
Current operating data does not show AI hurting demand: occupancy remains around 91% and rental revisions are strong. The risk is forward-looking. If AI materially raises productivity across software, finance and support functions, tenants may need less incremental headcount and therefore less office space, weakening future occupancy and rent growth. Again, here too the jury is out but this risk can turn out to be worse than we expect.
Interest-rate risk remains a key sensitivity
REITs are inherently interest-rate sensitive given their leveraged balance sheets and income-oriented valuation framework. While US rates moved to multi-decade highs in the recent cycle, SGD and INR benchmark rates have not risen to the same extent and have partly decoupled from US rates in the longer-term range, which is important as these are CLINT’s primary funding currencies. The key risk is therefore a material rise in SGD or INR borrowing costs. Higher rates would increase financing expense as debt is refinanced, reducing distributable income and DPU, while also putting upward pressure on property capitalisation rates and discount rates, which could lower asset valuations and NAV. A simultaneous hit to both earnings and valuation would therefore be a meaningful downside risk for the stock.
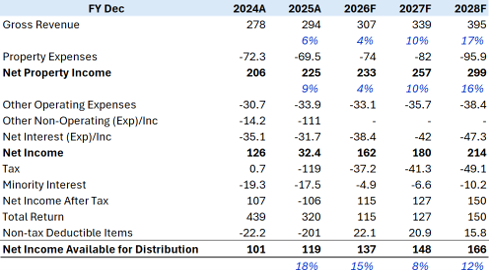
Financial Tables (Source: Company Filings, RVAM)
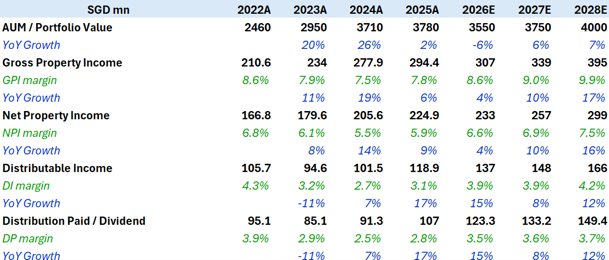
Income Statement (SGD mln.)
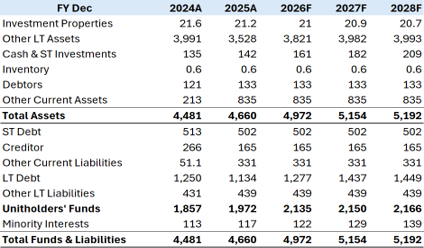
Balance Sheet (SGD mln.)
Absolute financial performance
End
Disclaimer
This material is not intended as an offer or solicitation for the purchase or sale of any financial instrument. Information has been obtained from sources believed to be reliable. However, neither its accuracy and completeness, nor the opinions based thereon are guaranteed. Opinions and estimates constitute our judgement as of the date of this material and are subject to change without notice. Past performance is not indicative of future results. This information is directed at accredited investors and institutional investors only.