The China narrative has worsened and is now consistently negative across the board (especially in the western/global media and amongst global investors). During such times, it is important to try and look through the haze and focus on facts and numbers. In this piece we follow up on a point we made a few months ago on the property sector correction. And, separately, we also take a look at the actual earnings performance of the six largest Chinese tech stocks. Both these point to positive change at the margin, which the market seems to be ignoring.
Property Sales Correction – We Are Very Near The Bottom
Chinese primary residential property sales will be at best about Rmb 10-11 trln this year (till July it is only Rmb 6.3 trln.). This number has dropped from a high of over Rmb 16.3 trln. in 2021, i.e. a drop of over 35%. This would take the absolute sales number back by over six years to the run rate in 2017. We had mentioned this in our monthly a few months ago and the trend continues.
We want to look at this sharp drop in another way: residential sales as a percentage of GDP. This number is important to focus on, given the perceived high dependence of the Chinese GDP on property sales. The number often touted is 17-18% directly and 23-24% if we were to include connected industries like white goods. The problem with this often-repeated number is that, though it was true in 2021, it has completely changed in the last two years. The direct dependence of GDP on this sector has dropped from a peak of 17.4% in May 2021 to 8.8% in July 2023 and will potentially be about 8% for CY2023. This ratio has gone back to numbers seen in 2005. This is one of the sharpest slowdowns of such a systemically important sector and it is surprising that more things have not financially blown up in China.
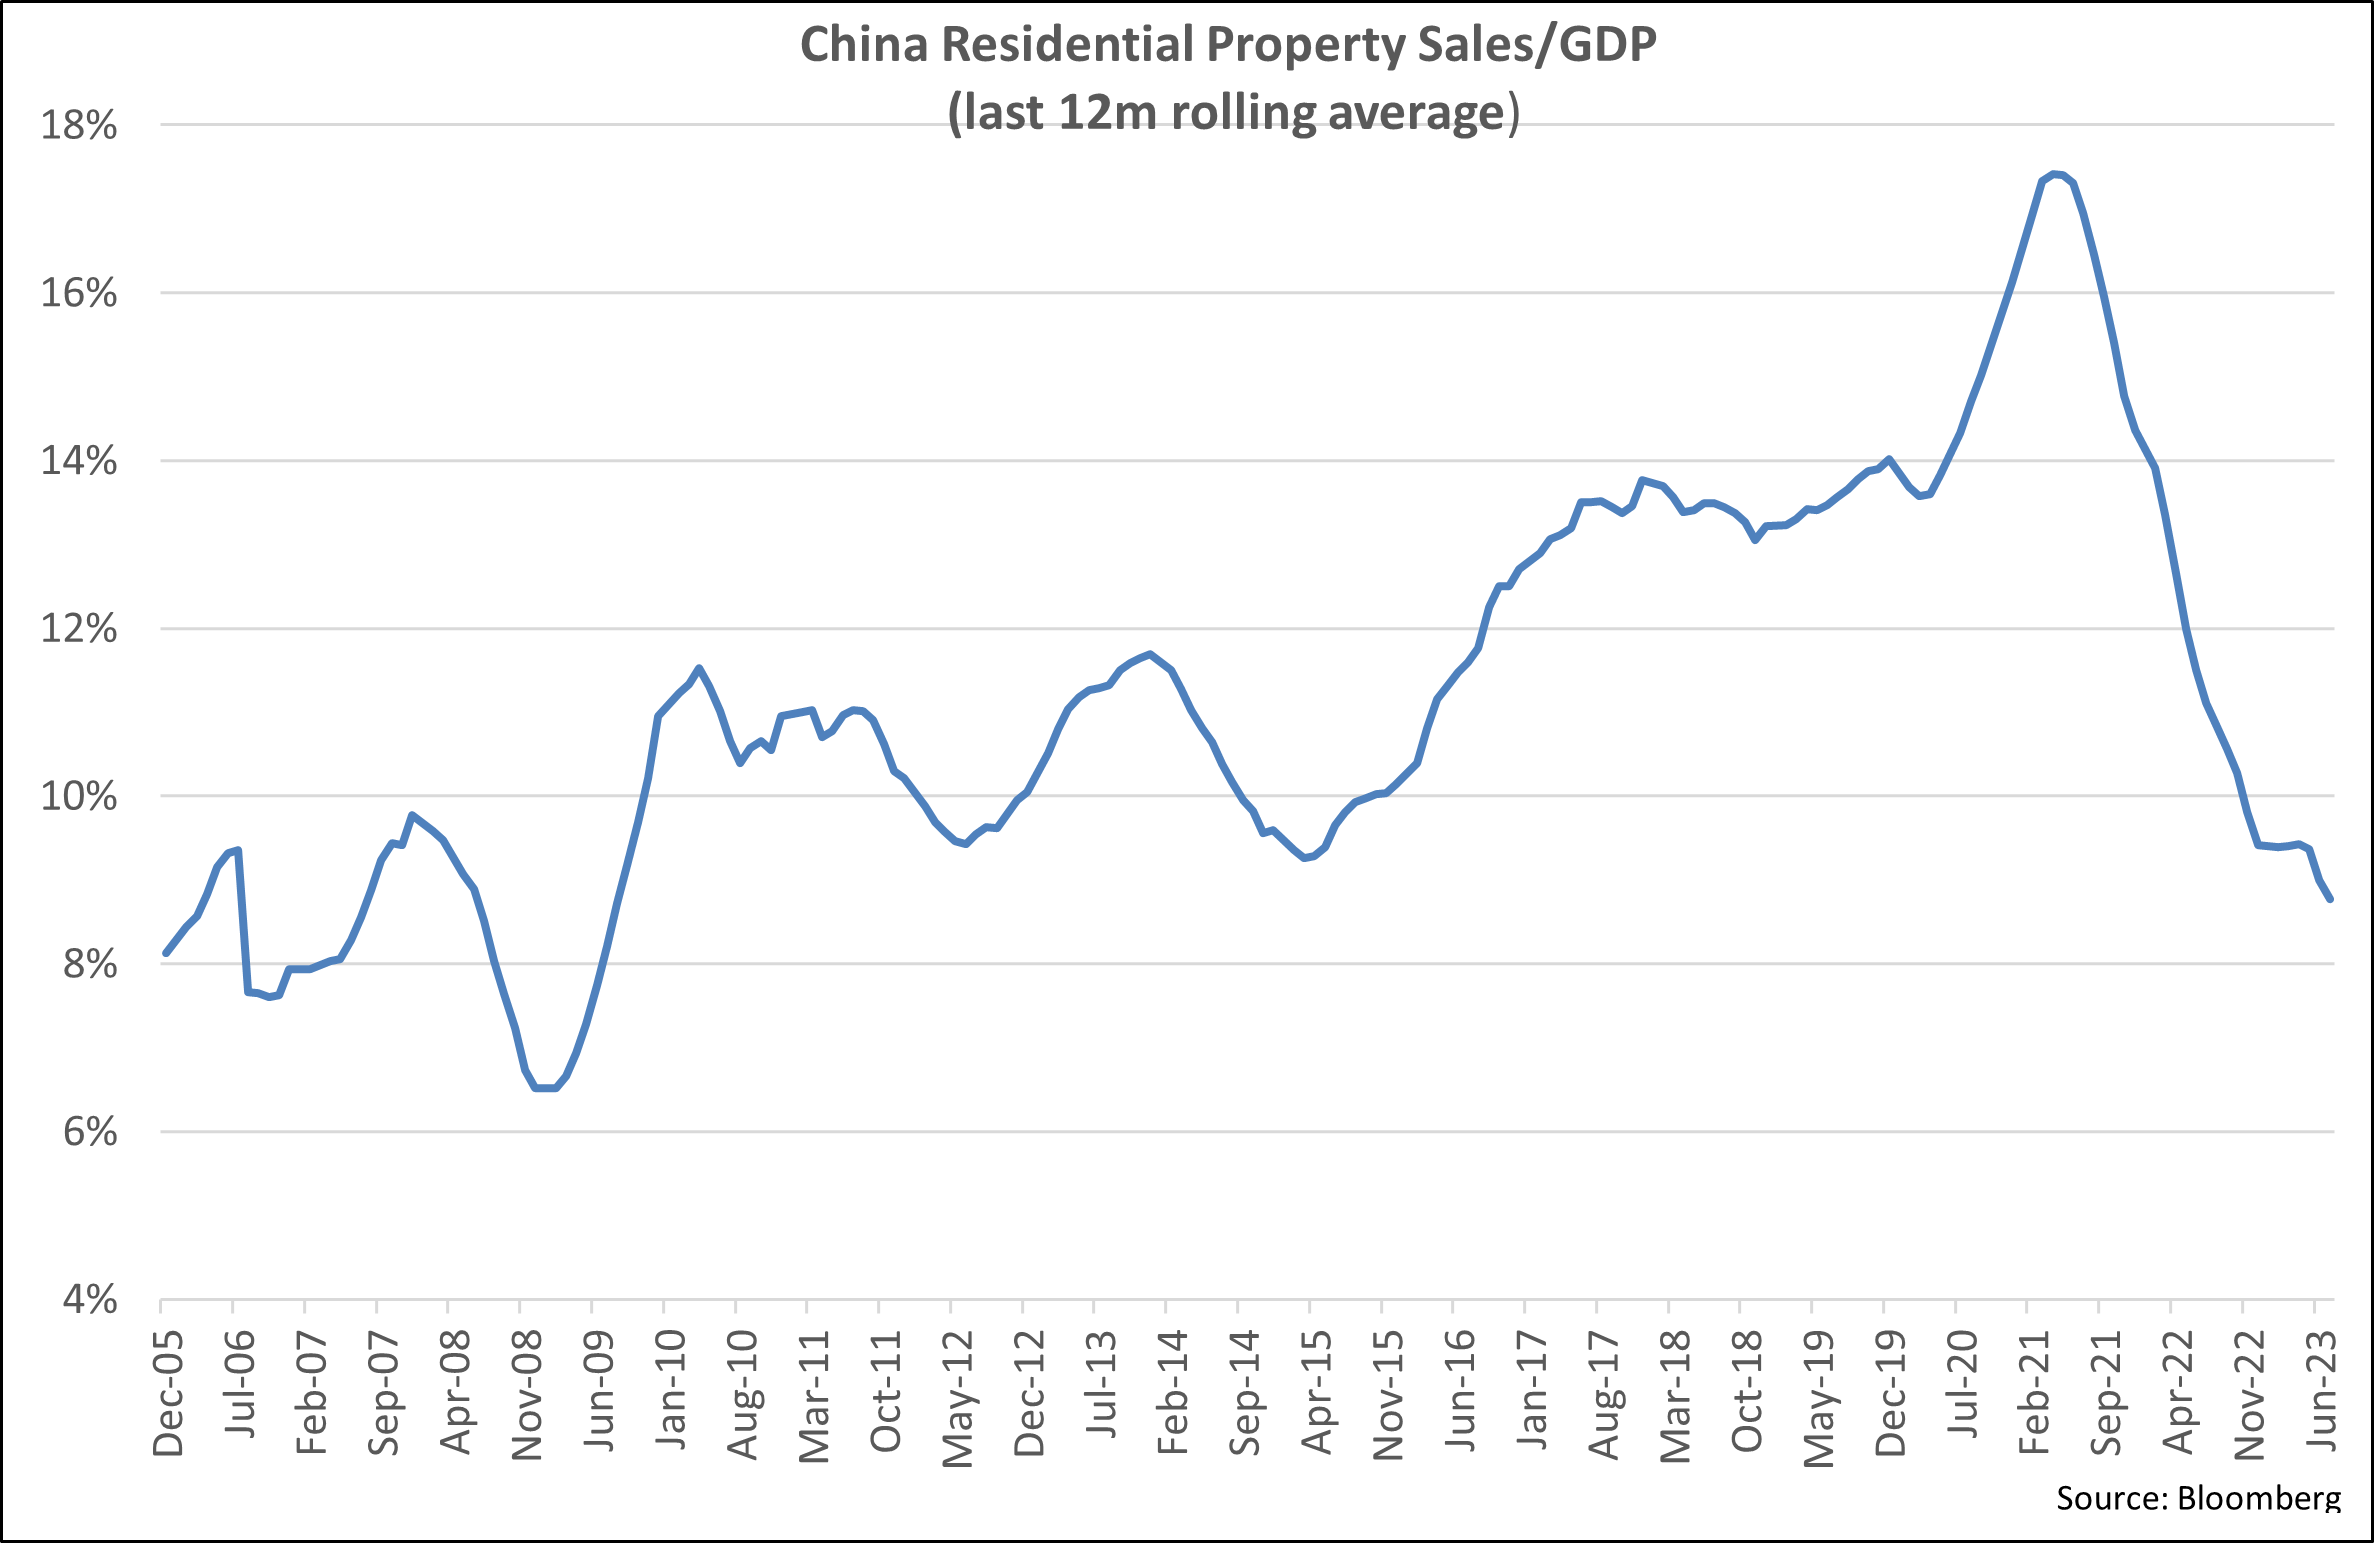
Given this, we make the case that Chinese property demand is broadly at a level purely supported by owner-occupiers. Most of the investors have been shaken out. This is a broad generalisation but, remember, at the peak about 40% of Chinese property demand was from investors – broadly the same number as the fall in new residential sales from the peak.
Combine the above with the increasingly favourable regulatory push, and there is a high likelihood that we are near a bottom in residential property sales in China. The economic repercussions of this sharp drop will continue to be felt for 12-24 months more, but the underlying sales slowdown is over.
The second point on property we want to make is that all the problems are at the sellers’ end – i.e. property developers, local governments that benefit from land sales, private sources of funding for these entities, etc. There is very low stress at the buyers’ end (primarily individuals). This is shown by the ratio of outstanding mortgages to total potential stock of properties. We take the total potential stock of residential properties as all the properties sold since 2003 at original cost. This is obviously understated as market prices have moved up in the last two decades, but it still proves the point we are making.
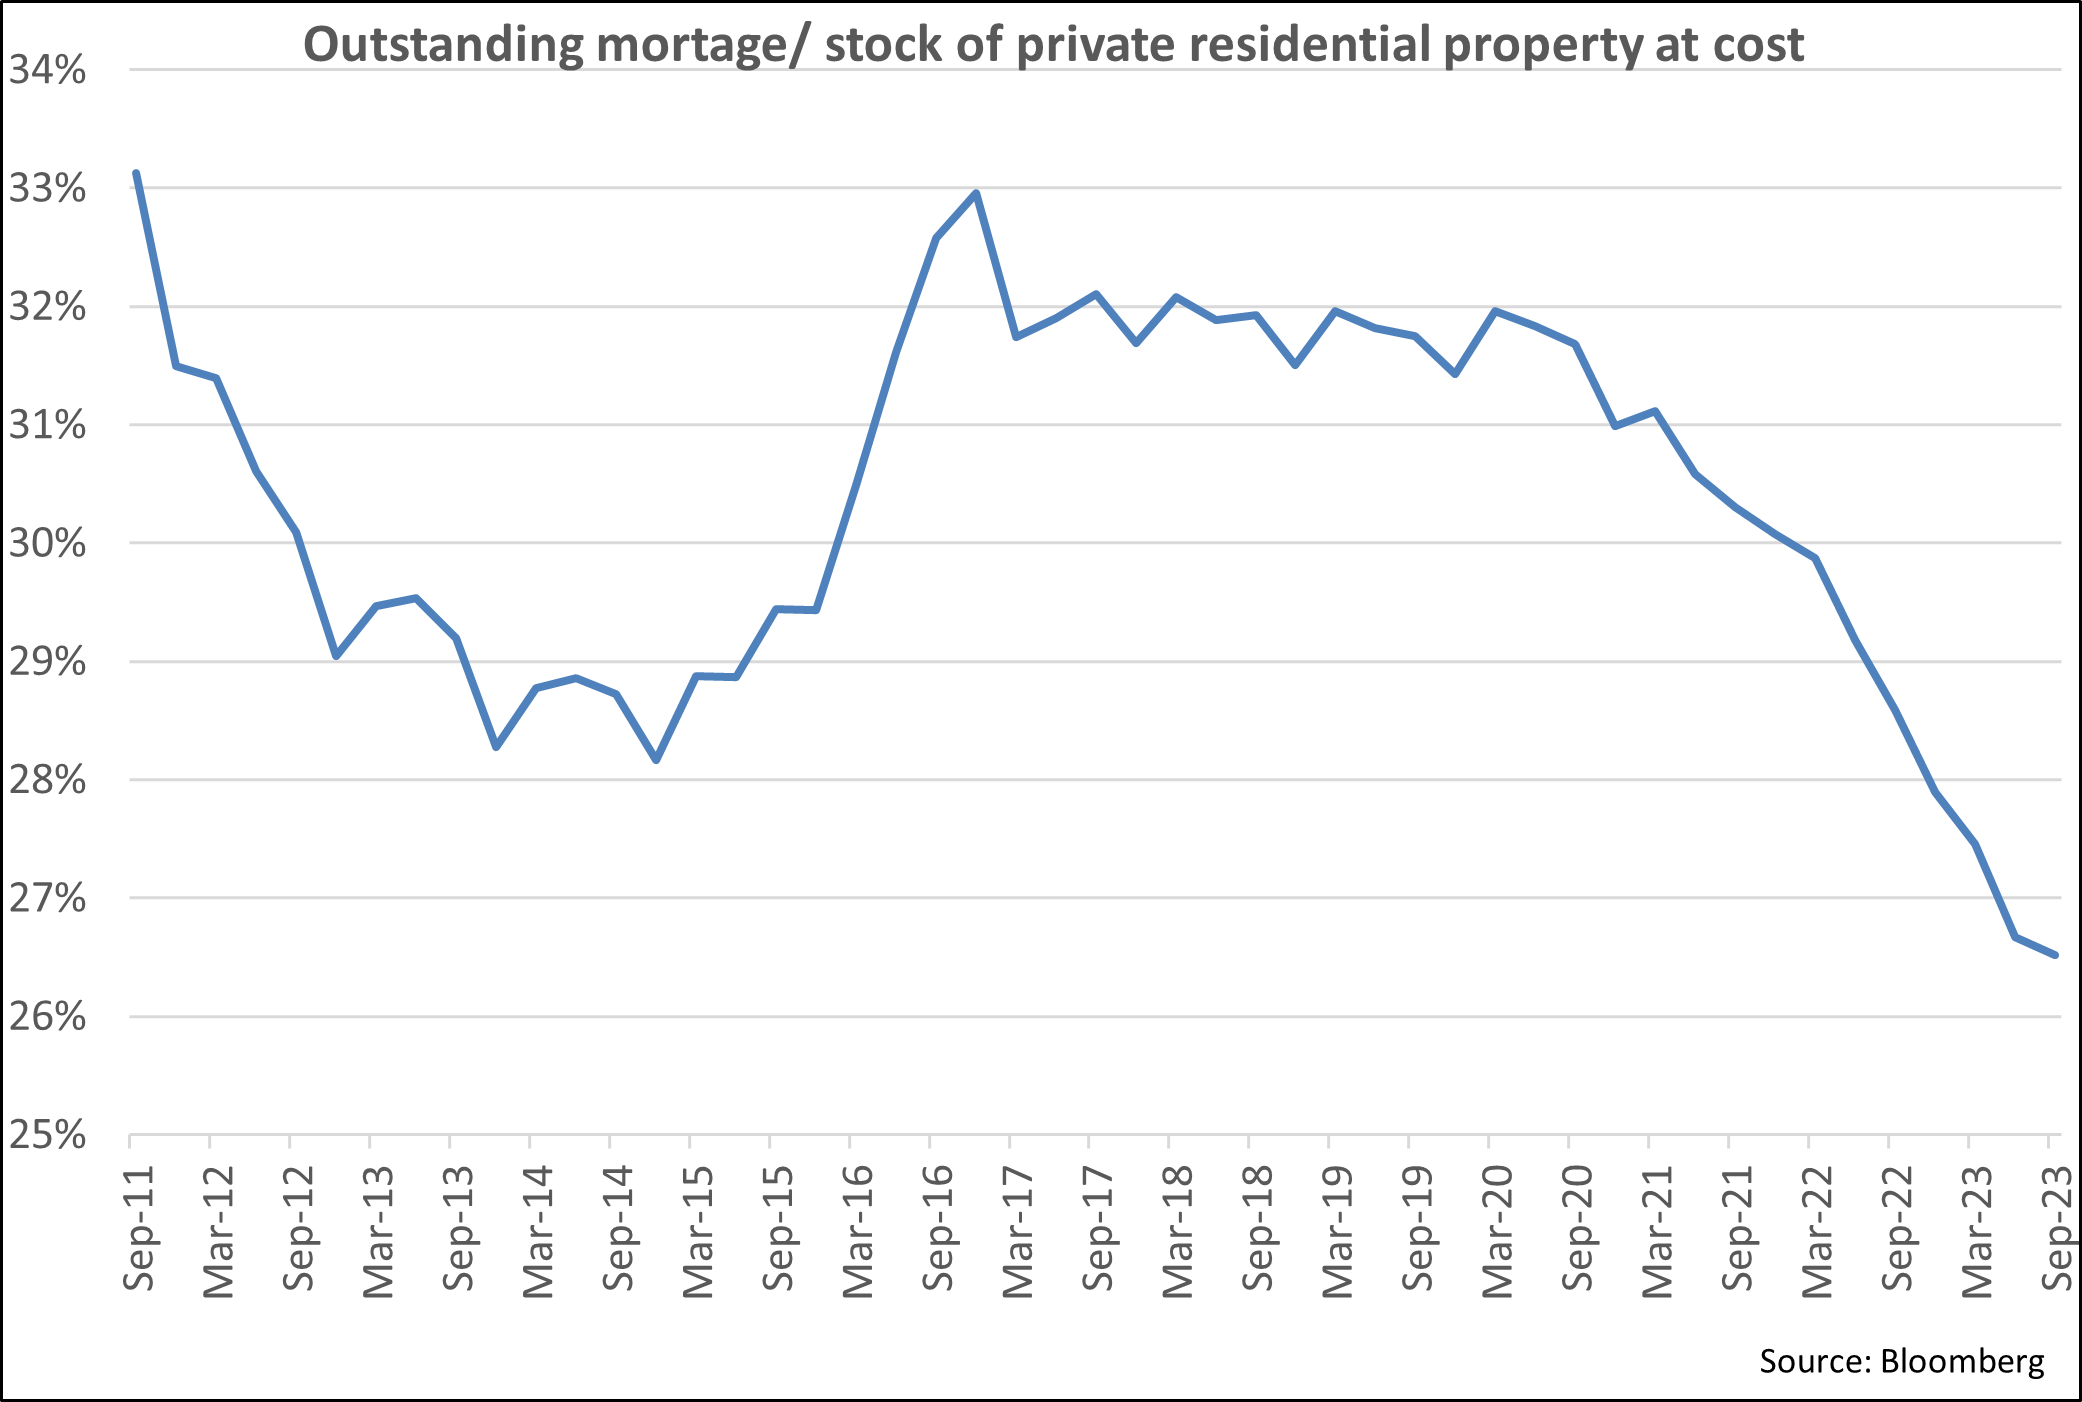
This ratio which defines a broad ‘mortgage loan/value’ for residential properties across China was always below 33% and has been dropping sharply in the last two years. It moved from a peak of 33% to 27% of property value. With the dropping interest rates the monthly mortgage repayment cash burden has dropped even more. Hence, it is difficult to see any stress at the property owner’s level. Something very different from the U.S. crisis of 2008 or the Japanese problems of the 1990s.
Tech Earnings Inflecting
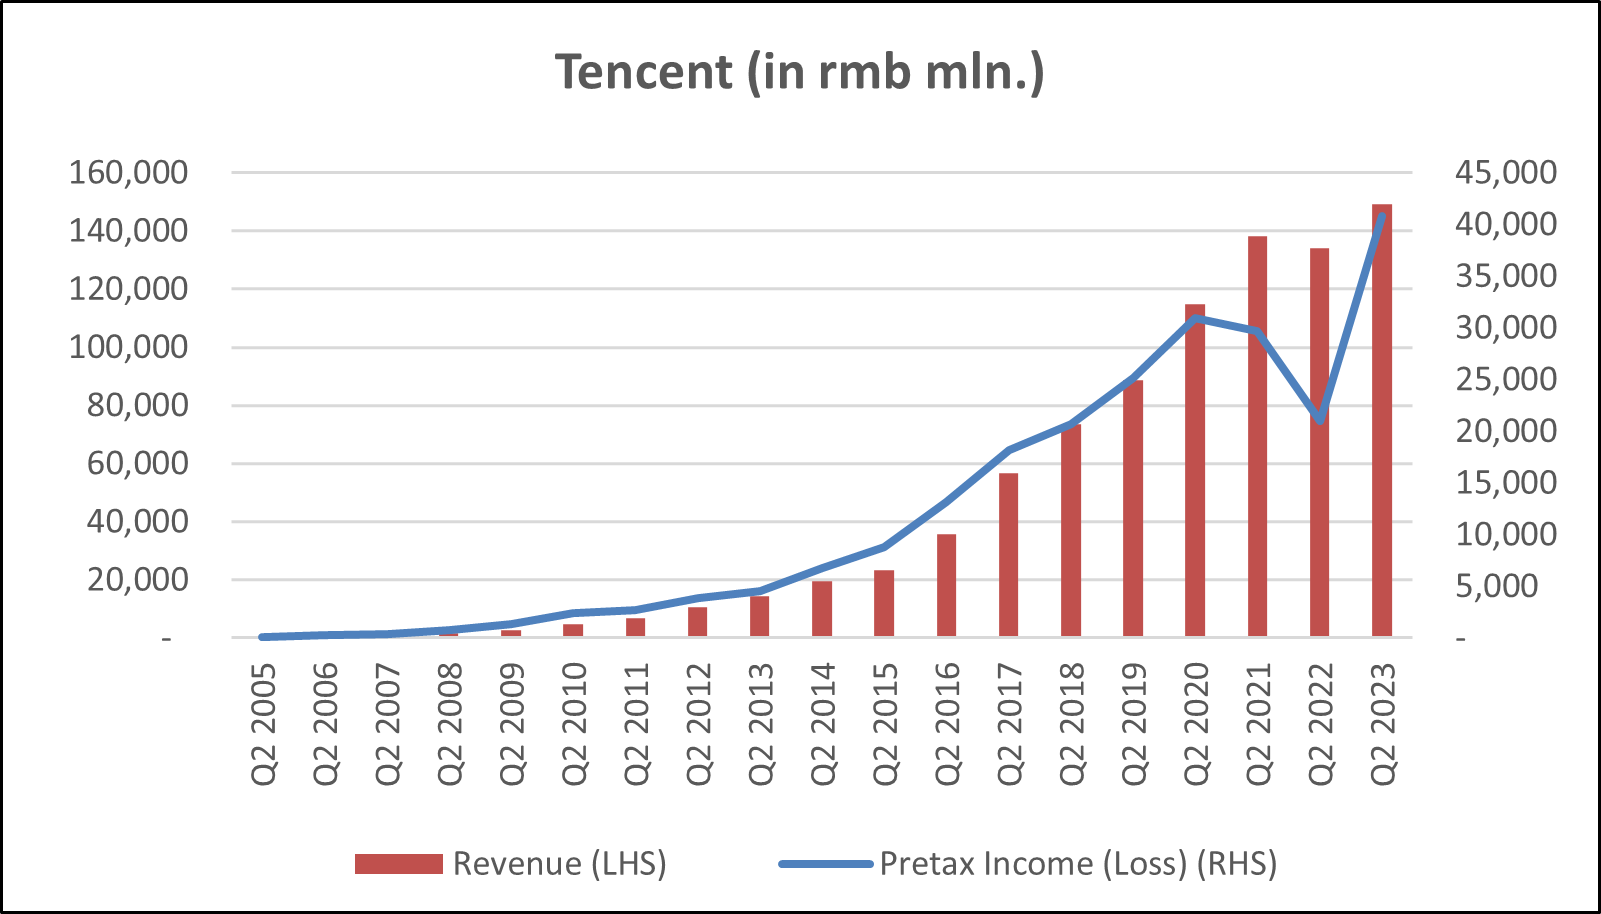
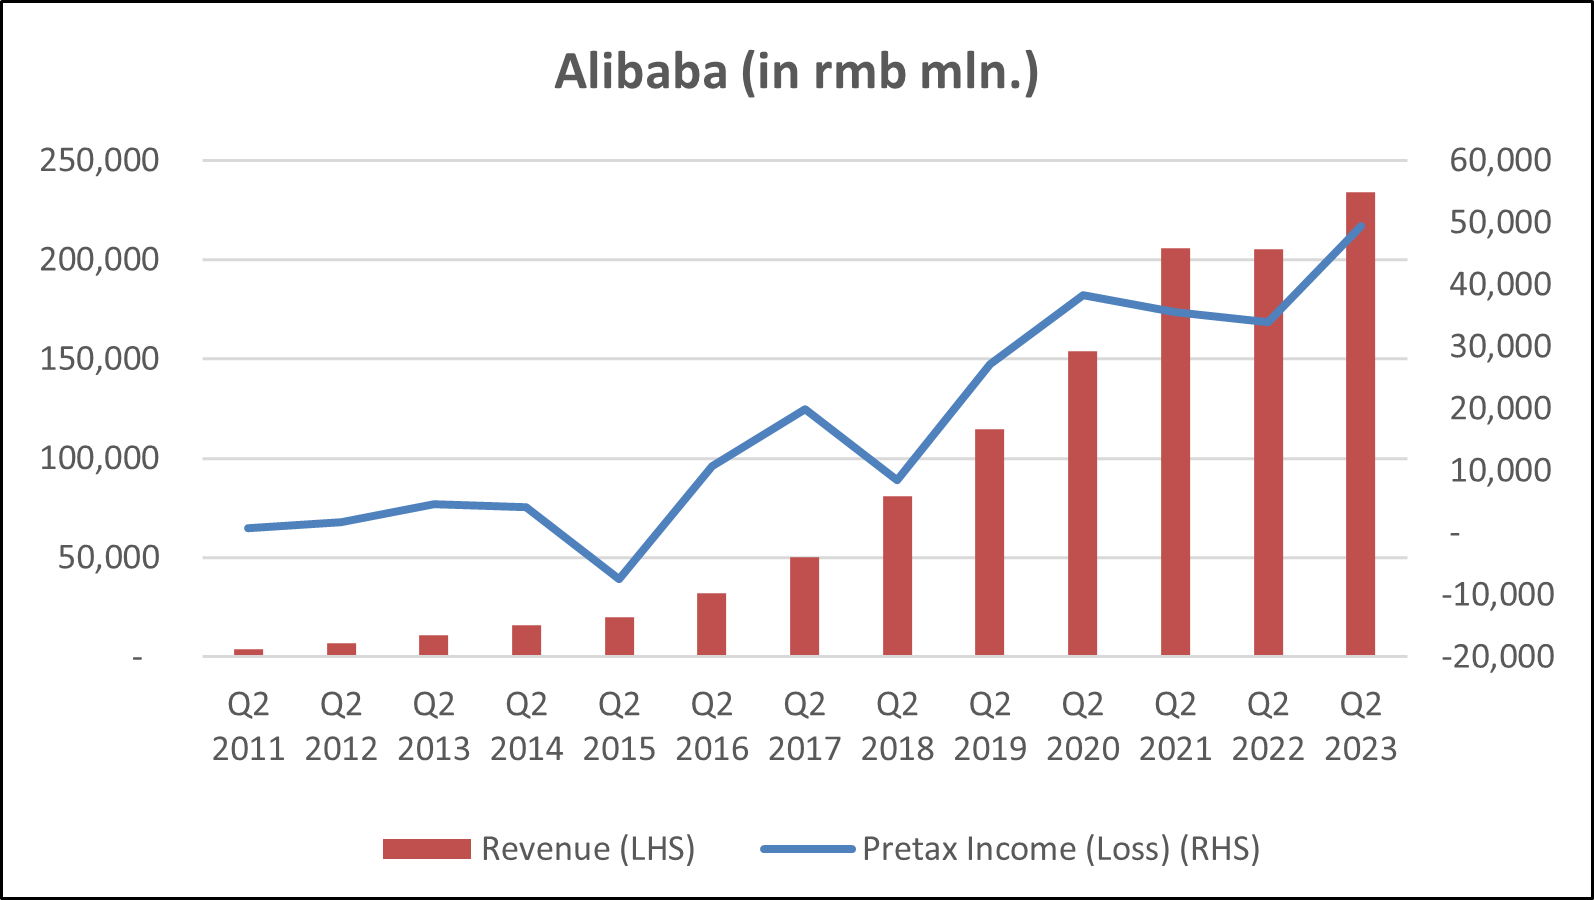
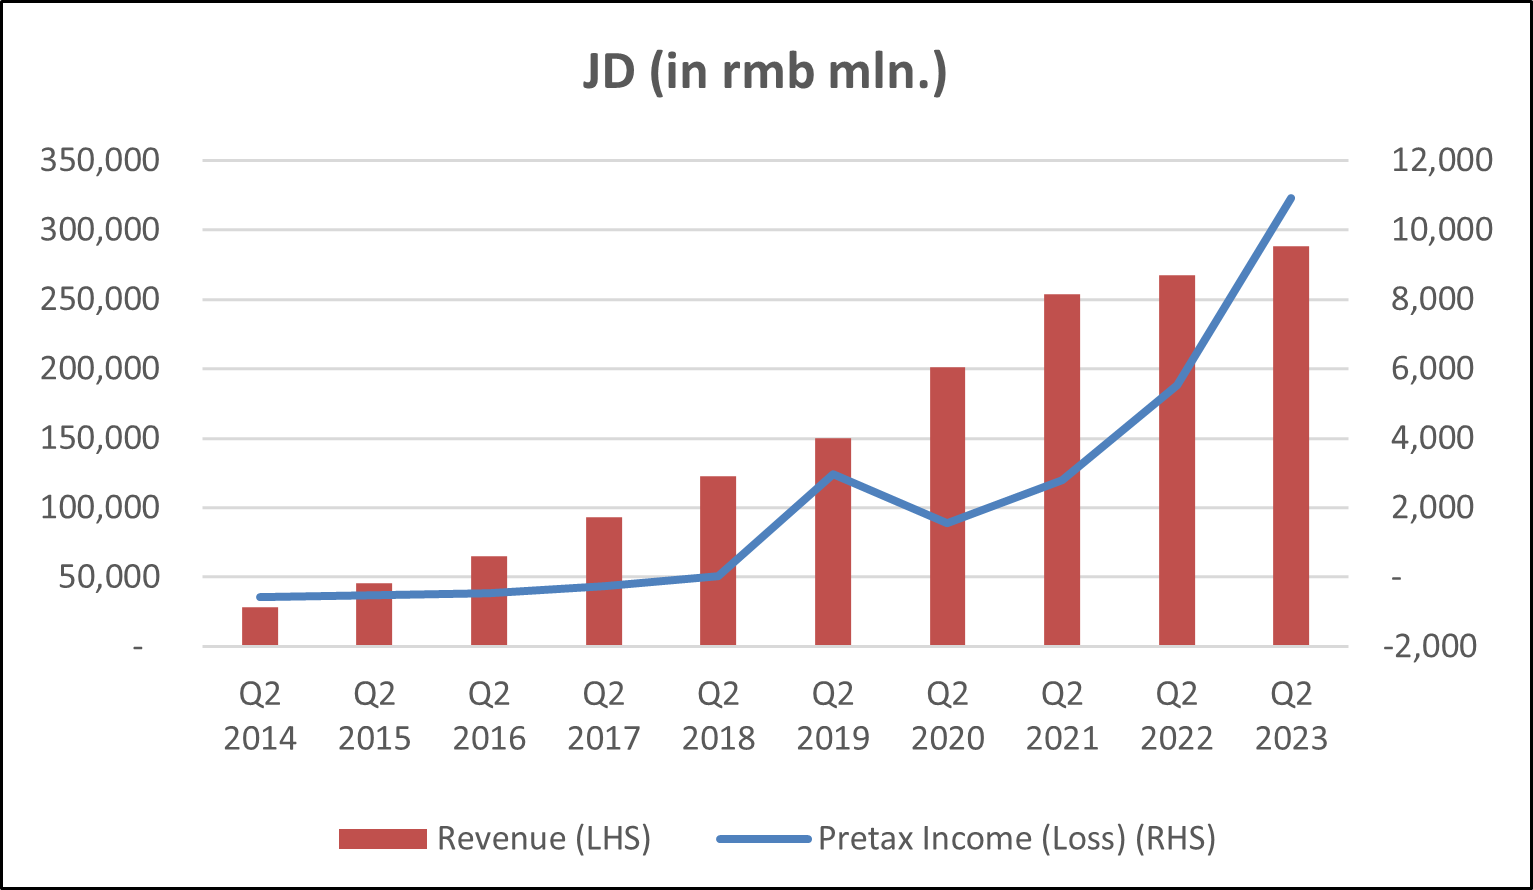
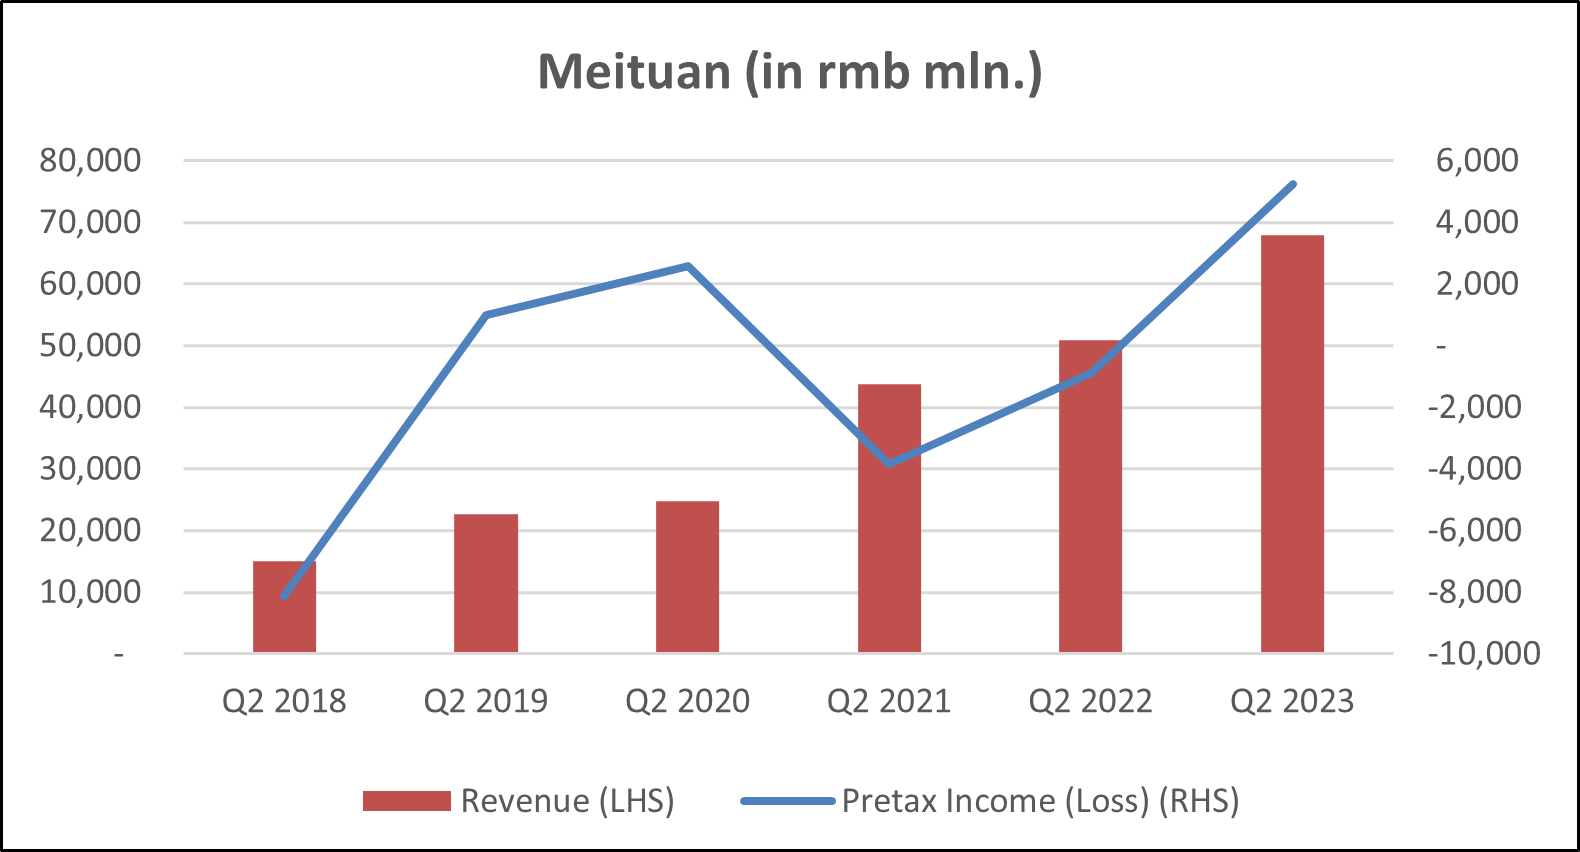
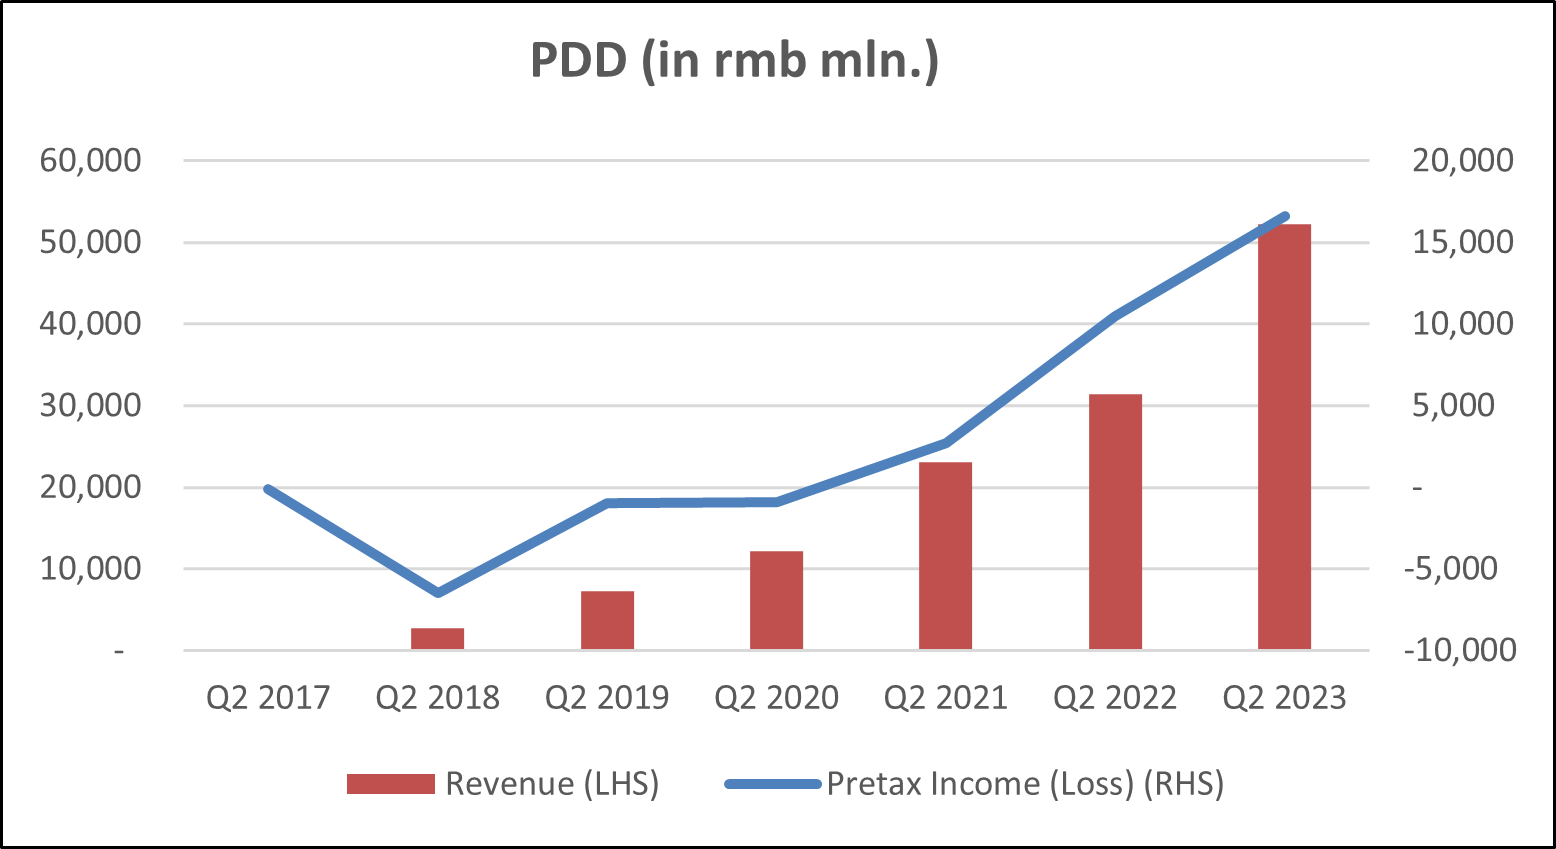
The second quarter of 2023 was a record quarter for the top six tech companies in China in terms of both revenue and profits, the best second quarter in history. The six stocks we looked at are Alibaba, Tencent, Baidu, JD, Meituan and Pinduoduo (PDD). We have compared the Q2 2023 numbers only with the Q2 numbers of the past to rule out seasonality.
The numbers are strong in both absolute and growth terms. Margins and sales are at historic highs, leading to historic high profits. All these companies have beaten expectations on sales and profit. Importantly, the qualitative forward guidance remains cautiously positive. Though the short term might still be volatile, we feel these stocks are creating historic bottom ranges. The improvement in fundamentals is here to stay, though it might be a bit volatile. This is another fact that is being lost in the current haze of negative narrative about China.



Source for all charts: Bloomberg
Conclusion
China is like an addict putting himself through a brutal “cold turkey” as it cures itself of its addiction to property. While that happens, the collateral damage and pain is high. This is probably as brutal as the SOE reforms under Zhu Rongji in the mid-1990s. Through these reforms, over a 5-year period, 35% of the SOE employees were let go – that was about 40 million people. It was sharp and brutal but good for the long term. The property sector reset is into its fourth year now from the regulatory front. We think the maximum direct impact is behind us, though the collateral damage will keep flowing in for the next 12-24 months. As mentioned earlier, direct property sector is only about 8% of GDP now, down from over 17% in early 2021.
Hence, it is time to refocus on the rest of the Chinese economy. Here, the tech sector is showing signs of stabilisation. Financial numbers, regulatory risks and market trends seem to be on a normalised track. With last quarter earnings at historic highs for these stocks, and valuations near historic lows, we see a clear case to look at these stocks in earnest again.
Cover photo by Ralf Leineweber on Unsplash
End
Disclaimer
This material is not intended as an offer or solicitation for the purchase or sale of any financial instrument. Information has been obtained from sources believed to be reliable. However, neither its accuracy and completeness, nor the opinions based thereon are guaranteed. Opinions and estimates constitute our judgement as of the date of this material and are subject to change without notice. Past performance is not indicative of future results. This information is directed at accredited investors and institutional investors only.
