Through our long investment careers, we have learnt, sometimes the hard way, that some of the best investment set-ups to back are those where there is a demand-supply imbalance situation on the horizon and where the catalysts lie for that imbalance to trigger off a strong and large price response in the underlying. Supply and demand are the most basic concepts, yet some of the hardest for analysts to accurately model or price. This is because most investors, in fact also most participants in that industry, anchor their expectations to the recent prices. Even the most bullish forecasters rarely fathom their bull cases to exceed a past or historic peak in prices or demand. When these scenarios do arrive, even industry participants tend to get caught unprepared—many of them getting run over by events. They simply cannot foresee tail scenarios where the oncoming demand-supply imbalance can possibly unleash a stronger price response than in the past. This is surprising, given that each cycle in history (especially those involving commodities) has shown that in each new cycle usually a new high or peak is made followed by a trough or low which is also higher than the previous cycle low.
For such an investment to succeed, making a bet on the set-up does not require us to predict the ultimate peak price. That is well-nigh impossible. All we have to do is ascertain that there is indeed a supply and demand imbalance (and the larger it is the better). After that, we need to understand the drivers on both the supply and demand sides. Are there new sources of supply that can likely come on quickly to balance the market? Is there an expected change in demand, and is it more positive or negative? Are there price levels that trigger switches to alternative commodities/ products on either the supply or demand side? Fundamentally, is there anything out there that will force us to adjust the math of the demand-supply equation along the way early enough to puncture the thesis and short-circuit the cycle prematurely. That is all we need to know.
Most investors fixate on a price target because it is a basic human instinct to calculate the money to be made if one gets the trend AND the price right. Actually, the most important thing to do is to focus on getting the trend of the cycle and when it will begin to play out. Allow the price to evolve on its own, as it is the market that will decide that, not us. The strength or weakness of the eventual price peak and the amplitude of the cycle will depend on the width of the demand-supply gap that we try to estimate. The bigger or wider the gap, the longer the cycle will last and the higher the prices will carry to profit from.
Post this long prologue, let us not waste any more breath but rather talk about the cycle we feel excited about and one which is perhaps already in play but in its nascent stages and one where the larger degree of set-up is likely to unfold over the next few years in this decade. We are talking about the world turning to nuclear power as an alternative source of energy in a significant shift to rid itself of the dependence on fossil fuels over the next few decades. This means that there is a viable set-up that will unleash a powerful demand for uranium before long. The uranium mining and enriching industry today is simply ill-prepared for this eventuality. Let us explain further.
Historical Backdrop of the Uranium Market
In the uranium market, high prices in the late 1970s gave way to depressed prices in the whole of 1980s and 1990s, with spot prices below the cost of production for all but the lowest-cost mines. Spot prices recovered from 2003 to 2009, but have been weak since then.
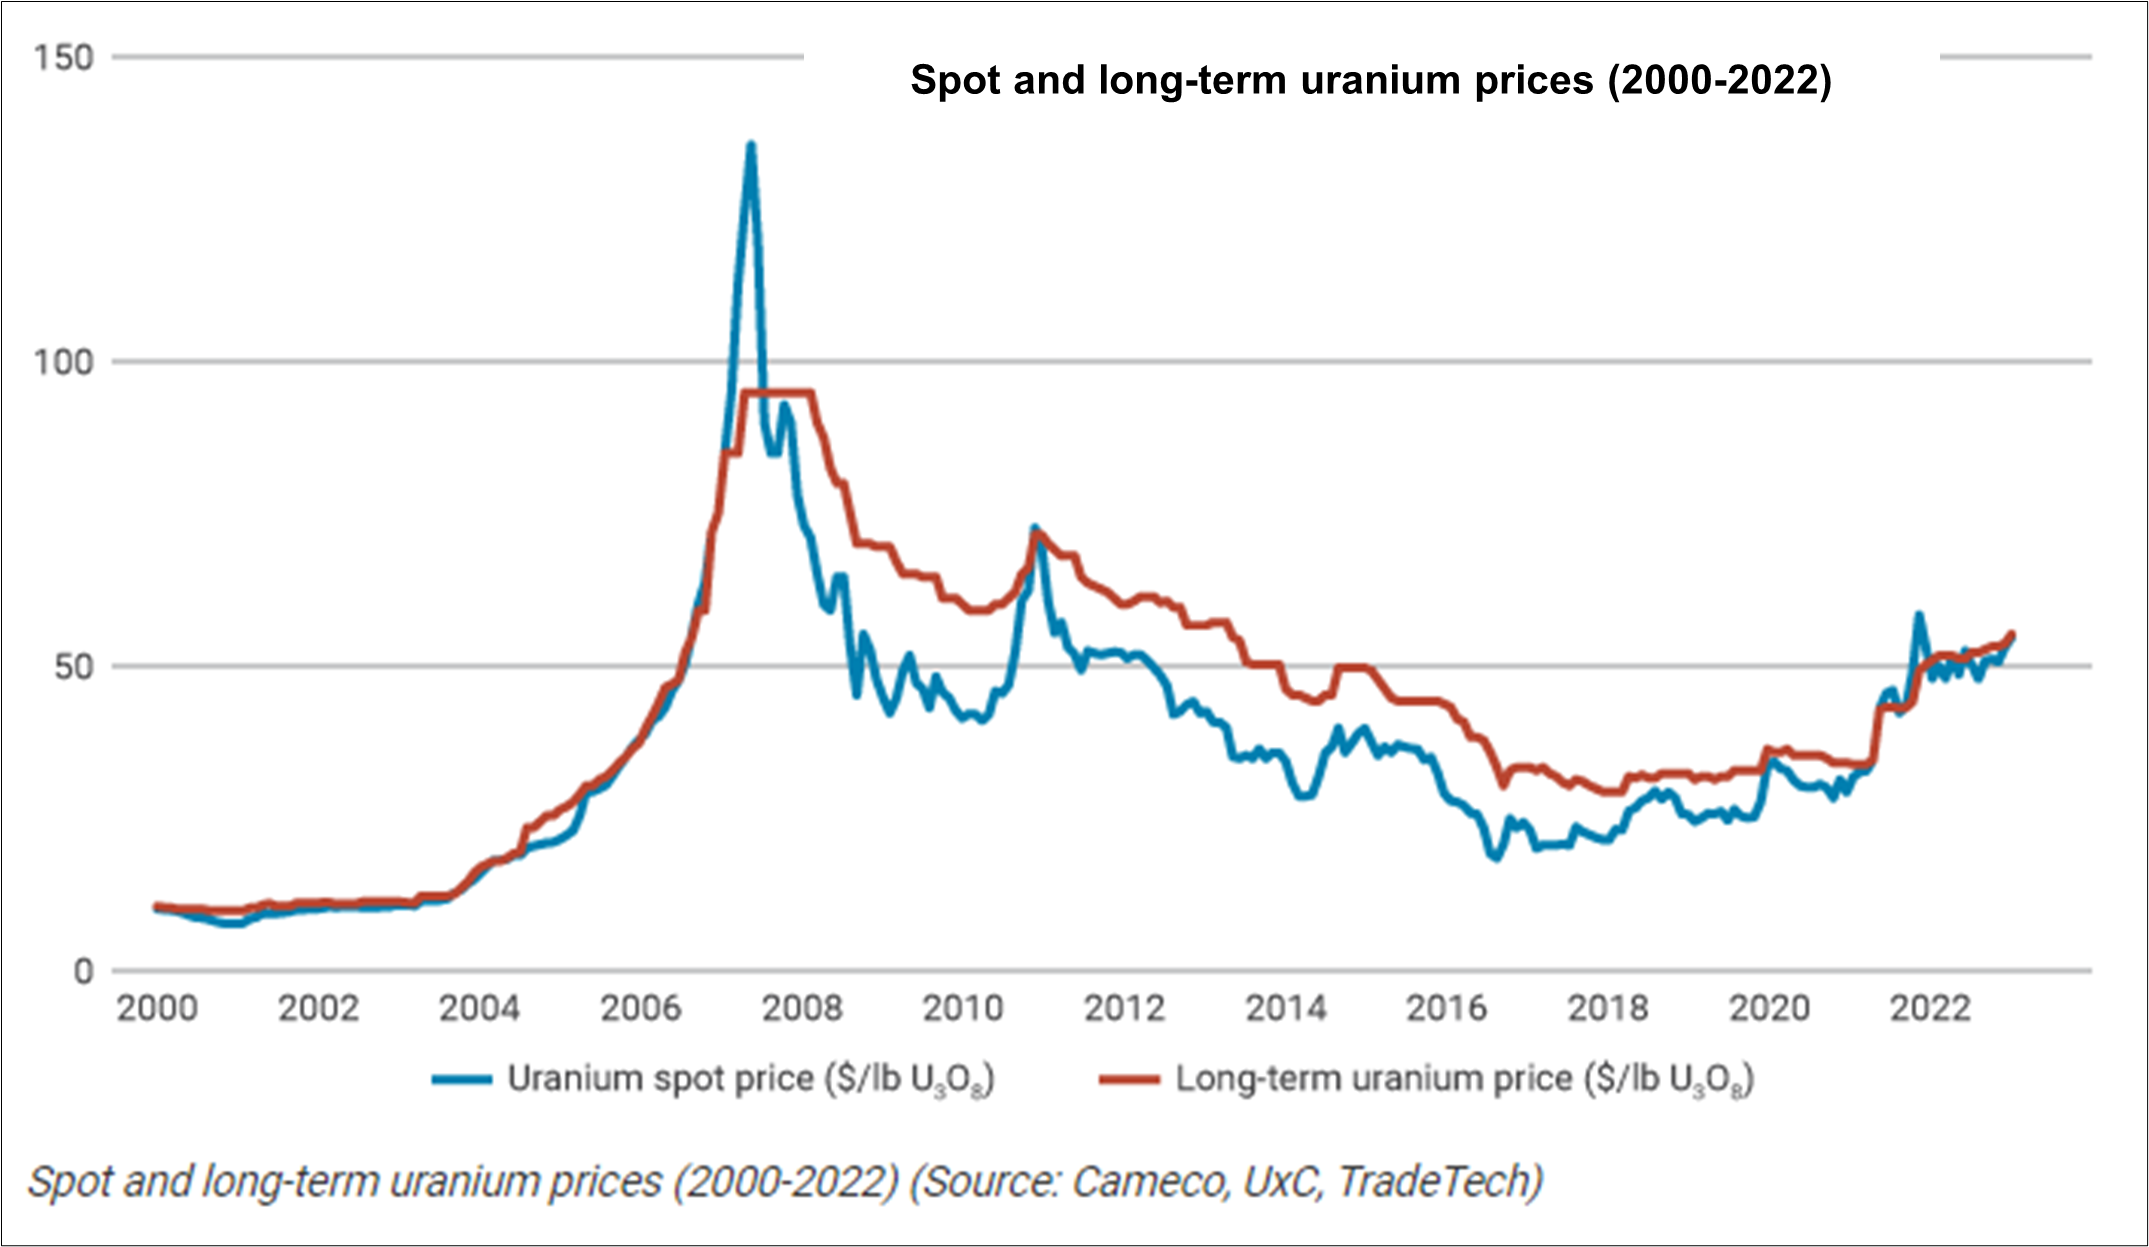
The quoted spot prices through to about 2007 applied only to day-to-day marginal trading and represented a small portion of supply, though since 2008 the proportion has approximately doubled to about one-quarter. Most trade is via 3–15-year term contracts, with producers selling directly to utilities at a higher price than the spot market, reflecting supply security. The specified price in these contracts is, however, often related to the spot price at the time of delivery.
In 2000, primary market participants – utilities and producers – accounted for 95% of the spot market. That share decreased to two-third by 2005 and to one-third by 2011 and it has remained at 30-40% since. The rest comes from the financial community, namely traders and financiers, who have moved in on the market, bringing greater liquidity and efficiency.
Processing and Refining
The uranium ore, produced from both underground and open pit mining processes, is crushed and ground in mills. Ground particles are then leached in tanks with sulfuric acid to dissolve the oxides. The consequent compound is dehydrated and roasted to yield U3O8, known as yellowcake. This is the form in which uranium is marketed and exported. Yellowcake is then sent to a conversion facility and converted into UF6, which is then enriched to ~4-5% concentrations of U-235 isotope for commercial energy purposes.
Secondary Sources of Uranium
Weapons-grade Uranium: Weapons-grade uranium from decommissioned nuclear warheads has been another alternative source of uranium (which of course is not quantified) and has concentration levels of ~90 – 95%. The uranium extracted from the warheads is blended with depleted uranium to produce uranium with concentration levels suitable for use by power utilities.
The Biggest Miners and Countries
The five largest uranium producing countries are Kazakhstan, Canada, Namibia, Australia and Uzbekistan; the collectively make up 85% of global production.
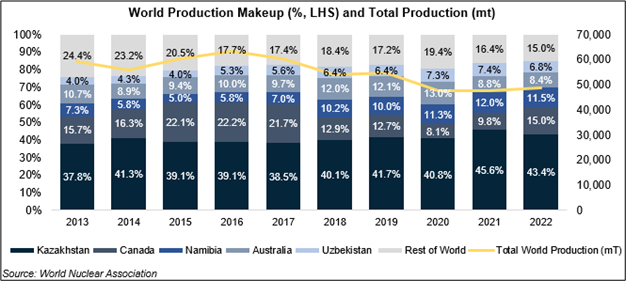
Kazatomprom, the state-owned miner from Kazakhstan, is the largest uranium producer globally and is responsible for 23% of global production. Cameco, Orano and CGN, which are second to fourth largest players respectively, produce 12%, 11% and 10% of global production respectively. These four companies make up 56% of global production, effectively establishing an oligopolistic market.
Nuclear Power Generation as a Growing Source of Uranium Demand
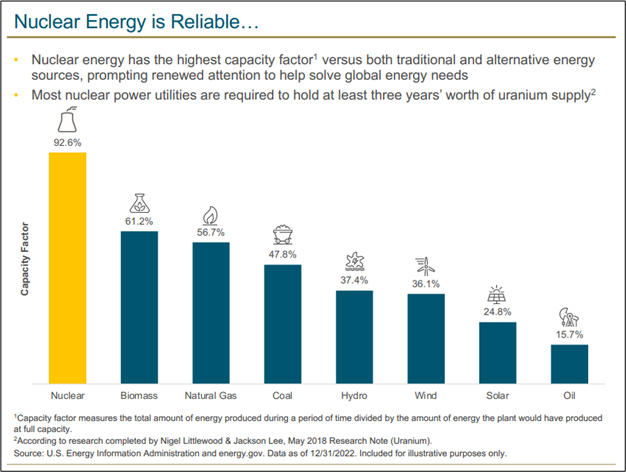
The cost structure of nuclear power generation involves high capital but low fuel costs (just 5-10% of cost of production). The demand for uranium fuel is much more predictable than with probably any other mineral commodity. Once reactors are built, it is very cost-effective to keep them running at high capacity. Demand forecasts for uranium thus depend largely on installed and operable capacity, regardless of economic fluctuations.
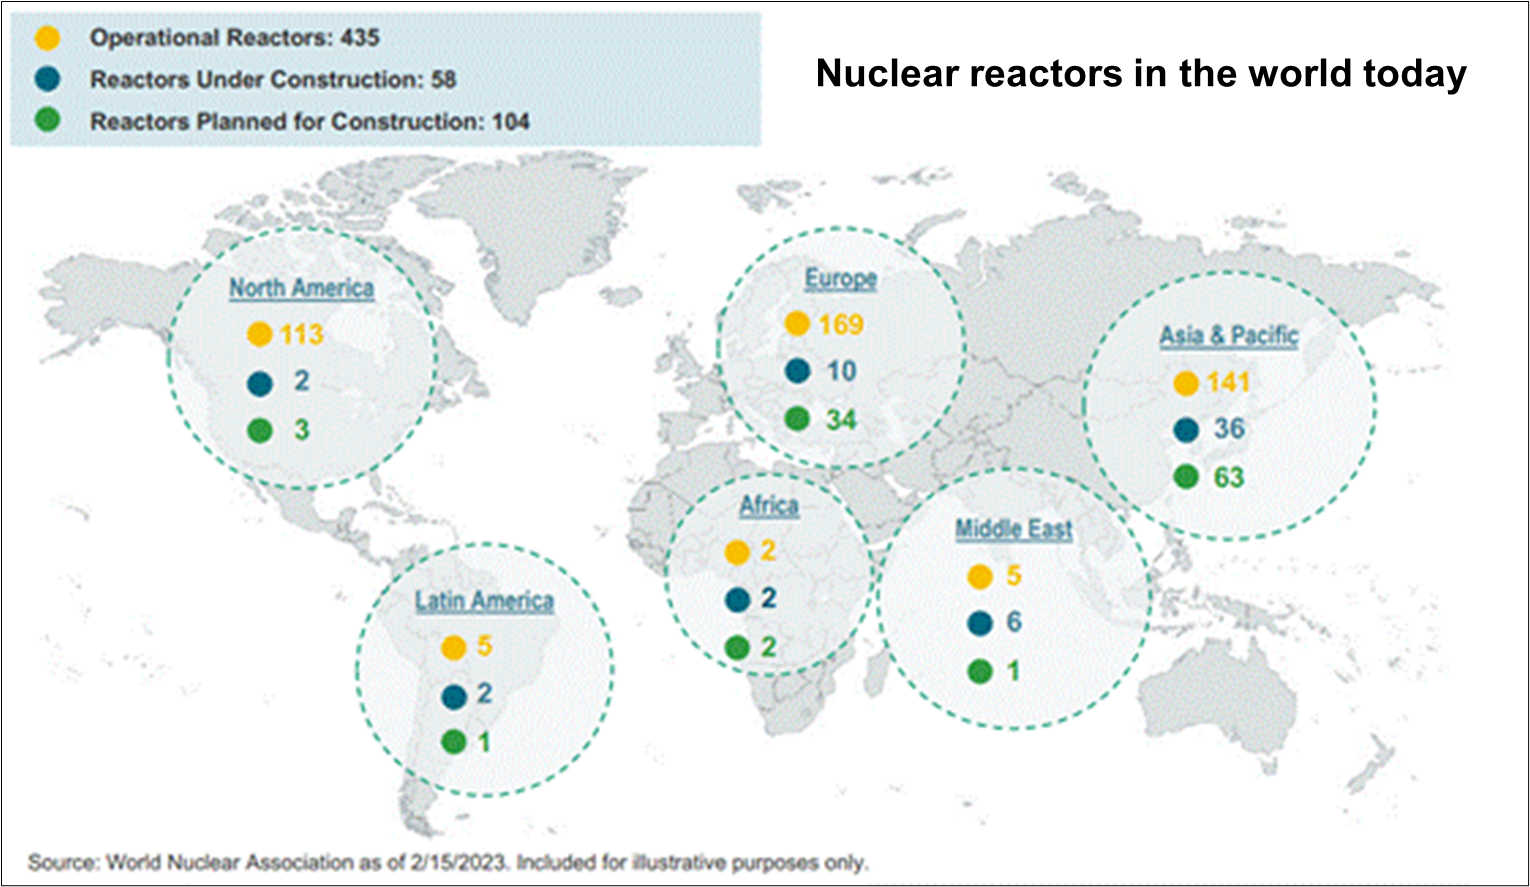
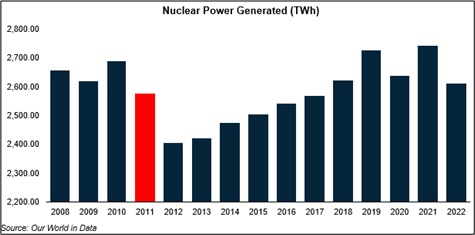
As of May 2023, there are 435 operational nuclear power plants globally (see chart below). Global nuclear power generation capacity is currently estimated to be 391,707 megawatts (MW), with ~2,600 terawatt hours (TWh) of power generated in 2022. Over the past few years, nuclear power generation has been relatively stagnant, with total annual generation increasing a total of 8.6% from 2012–2022. Growth slowdown has largely been a product of reactor safety fears stemming from the Fukushima nuclear disaster in 2011.
However, the growing sensitivity towards decarbonisation and also ESG considerations, plus the Russia-Ukraine war and its impact on availability of enriched uranium from Russia, have all placed a serious question mark on uranium availability in the long term. Russia controls 27% of global uranium refining and 35% of enrichment as per sources.
At the same time, the political debate on safety of nuclear plants is slowly shifting, more out of need now to justify going nuclear the whole hog as a means to shift away from fossil fuels as a primary source of energy. As a result, new nuclear power plant capacities have been under implementation and several more are in planning stages all over the world, especially in countries like China and India. In the West, several states in the US which had banned nuclear power plants from being set up are now having a rethink and some have already amended legislation to allow more to be set up in future. Likewise in Europe, the dramatic shift towards gas and renewables post the Ukraine war has rejuvenated strong discussions on whether nuclear can be a strong #2 source of power over the coming decades after gas. The French obviously need no convincing given that nearly 70% of France is nuclear-powered.
Pipeline Projects
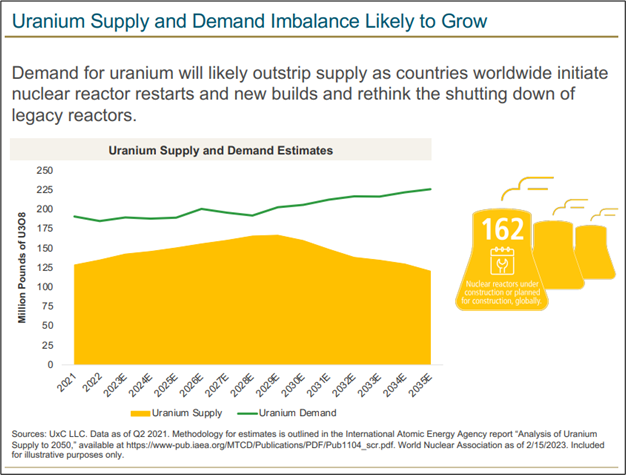
As per data from the World Nuclear Association, 58 nuclear plants are currently under construction and are estimated to add ~65,000 – 66,000 MW of additional generation capacity by 2030, representing a 16.6%-16.8% increase in current capacity. If we add to this the ‘planned’ capacities of 104 reactors which are nuclear plant proposals that have gotten regulatory approval but have not yet begun construction, global nuclear power generation capacity is expected to increase further by another ~102,000 MW, or ~26% of current power generation capacity, bringing total capacity growth to ~43% on current numbers. On top of these, an additional 323 reactors have been proposed, with over 154 coming from China, which would add substantially to the demand for uranium in the long term.
Today, power generation capacity consumes 66,065 MT of uranium at ~90% utilization. This demand is expected to increase by ~15% to 75,664 MT over the next five years as 57 of the 58 reactors under construction are expected to come online. This number further increases to 92,871 MT, once the 58 reactors under construction and the 104 planned are completed, representing an increase in uranium demand of ~40.5% from current levels.
Existing Nuclear Infrastructure
While many nuclear plants are reaching the upper limits of their useful lives, the risk of plants decommissioning and consequent decline in uranium demand remains considerably low. Many plants are reaching license expiries and governments have pivoted towards renewing and upgrading these plants to operate for 20-40 years longer by replacing older, obsolete components to keep up with output and clean energy commitments. This process is also known as uprating.
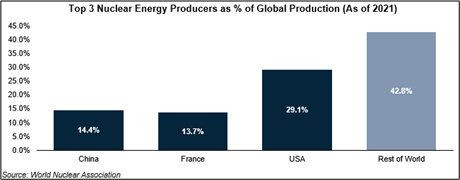
For example, the U.S. makes up 21.3% of global plant supply, with 93 operable plants. Nuclear power makes up a significant 20% of domestic electricity requirements. As of 2016, 85 out of the 93 nuclear plants in the country have had their operational lifetimes renewed by a minimum of 20 years. Shutdowns remain immaterial, with only 2 nuclear plants shut down since 2016. With current license extensions, only 7 reactors are expected to be phased out by 2029 out of the operational 93.
Consider how precarious the situation is in the U.S., the largest consumer of uranium. In May 2020, the U.S. Department of Energy created the Restoring America’s Competitive Nuclear Energy Advantage strategy. Not only would the strategic reserve protect U.S. energy during a crisis, but it would also spur domestic mining and conversion. In early 2022, the U.S. Department of Energy issued a bid to purchase up to one million pounds of domestically produced uranium. Later in 2022, Strata Energy was awarded the first contract and will supply 300,000 pounds to the reserve. While the reserve is a good start, it is still a long way from being a reliable back-up to international supplies. In 2021, U.S. utilities and plant operators consumed around 18,300 metric tons of uranium, or around 41 million pounds. That means when a supply chain crisis occurs, a one-million-pound strategic reserve could supply uranium for just nine days. In comparison, the Strategic Petroleum Reserve has the potential to last over a year.
France, which makes up almost half of the entire EU’s nuclear energy production, has announced the extension of all 56 of its nuclear plants beyond fifty years. China’s nuclear energy plants are relatively new, with its oldest plant, Qinshan Unit 1, beginning operations only in 1991. Currently, all of its oldest units commissioned in 1991-1994 nearing license expiry are undergoing uprating work and have gotten approval for license extensions.
These three countries, which make up 57% of global nuclear energy generation, should see minimal uranium demand loss from plant decommission.
Primary Supplies Remain Insufficient – Gap that cannot be met by Secondary Supplies
Mine Supply and Capacity
As of 2022, the amount of total uranium mined stands at 48,888 MT, which represents 74% of current uranium consumption by utilities. Over the last ten years, peak production volume stood at 63,207 MT mined in 2016, prior to the closure of Cameco’s McArthur River mine (representing ~12% annual global production at 100% capacity) as well as other smaller operations. To illustrate how drastic the current production shortfall is, even if supply were to immediately recover to this ten-year peak, it still falls short of meeting current global utility demands by 4.3%, an indication of how much catching up supply has to do to meet power utility demand.
Idle capacity in major operations such as the McArthur River Mine is expected to ramp up gradually, with 40% utilization expected in 2023 and a 72% utilization in 2024, capped till pricing improves. KATCO (a joint venture between Orano (51%) and the national mining company Kazatomprom (49%)), which contributes towards 5.2% of global production in 2022, is also expected to increase production back to 100% capacity earliest by 2026. This represents an estimated increase in uranium supply of 7,892 MT, falling short in even meeting the incremental demand of 9,599 MT of uranium expected from plants under construction, let alone reducing existing shortfall.
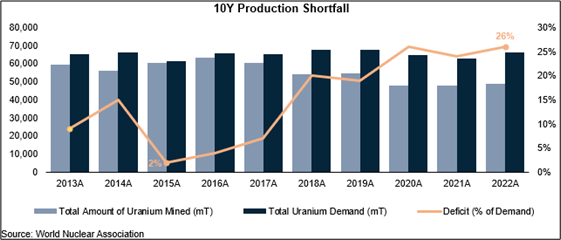
With other major mines either not announcing any changes to capacity utilization or already operating at full capacity, deficits are expected to largely remain in place and widen further as new plants under construction become operational over the next few years.
Based on reported nuclear plant grid connection schedules from the World Nuclear Association, nuclear energy contribution is expected to expand by 6,622 MW, 12,070 MW, and 9,622 MW on a 1Y, 2Y and 3Y forward basis respectively. At average global reactor efficiencies of 2022/2023, this represents an incremental annual uranium demand of 1,117, 2,036, and 1,623 MT for the next three years, with similar annual estimates extending to 2028.
For our forward estimates on supply growth, we assume that plans for increased production in the ten largest mines will make up any material increase, illustrated by the above chart. On a base case, reviving idle capacity in major mining operations is expected to briefly reduce the global uranium deficit by 6% of demand. However, with no future plans in place for suppliers to maximize capacity utilization beyond 2026, we note that incremental demand from upcoming grid connections is expected to widen the deficit back to 25% by 2028.
Secondary Uranium Sources
Existing deficits are currently supplied by secondary sources such as down-blending, civil reserves around the globe and underfeeding. Information on down–blending remains old and outdated, with latest updates being in 2013. With regards to the availability of the second source, civil reserves with governments as of 2020 stand at 282,000 MT, the equivalent of roughly four years of global consumption. We note that it is unlikely this reserve is being replenished, considering production deficits from primary sources (mines), and is actually being drawn down consistently.
Underfeeding, in particular, has supported uranium requirements by reactors, as longer spin times reduce degree of waste (tail assays). Prior to Fukushima, average nuclear plant tail assays were estimated at 0.30%, which represented uranium ore requirements of 175MT/GWe/Y. Underfeeding post Fukushima has resulted in an estimated tail assay of 0.25%, which represented an 8.6% decline in uranium requirements. However, moving forward, the transition of underfeeding towards overfeeding is expected to accelerate with no new contracts being signed between western utilities and Russian uranium processors, increasing uranium ore needs due to lower spin times by existing enrichers.
Recycling of Used Nuclear Fuel
In nuclear plants, fissile uranium (U-235) is mostly converted into U-238 and plutonium, alongside other actinides. Used fuel comprises ~95% U-238, 1% U-235 and 1% plutonium. Reprocessed uranium (RepU) can either be re-enriched for conventional nuclear reactors, used in its raw form for pressurized heavy water reactors (PWHRs), or converted into plutonium which then can be re-fed into the nuclear reactor.
Currently, the primary use of RepU is to enrich it and subsequently mix it with plutonium to create mixed oxide fuel (MOX), which cannot be used in conventional reactors. Reactors need custom adjustments to be able to properly utilize MOX. MOX currently makes up only 5% of global nuclear fuel needs and still requires fresh uranium for enrichment purposes.
Apart from the controversial nature of reprocessing nuclear fuel which generates plutonium, a key ingredient for the manufacturing of warheads, the recycling of used nuclear fuel as a short-term substitute for freshly mined uranium is not material for the following reasons:
- Used nuclear fuel, unlike freshly mined uranium, is extremely radioactive due to the presence of radiotoxic isotopes and actinides. This makes processing and packaging of the material challenging and dangerous;
- Uranium extracted from used nuclear fuel contains extremely low concentrations of fissile U-235 and other isotopes which are neutron absorbers, disruptive towards nuclear fission reactions that occur in the power generation process. This means that used uranium needs to be enriched up to 10% more than fresh uranium to be used in reactors;
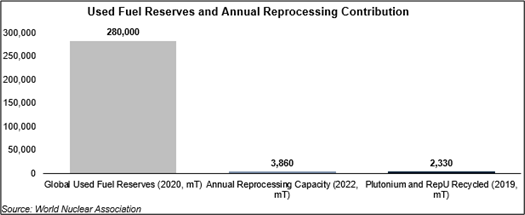
- Capacity for reprocessing remains extremely low. Current civil reprocessing capacity globally stands at 3,860MT, on an estimated global used fuel reserve of 280,000 MT. With used uranium having only 1/4 the U-235 concentration compared to enriched uranium, any salient contributions toward secondary supply remain unlikely in the near term;
- Current use cases are immaterial in terms of displacing demand. Based on the 2019 World Nuclear Association Fuel Report, contributions of enriched RepU in nuclear fuel needs were estimated to be 1,200 MT, only ~1.8% of the year’s global uranium needs. Combining this with the use of plutonium in MOX, total natural uranium demand displaced stood at 2,330 MT as of 2019, or ~3.4% of annual global uranium needs.
Exploration and Greenfield Projects
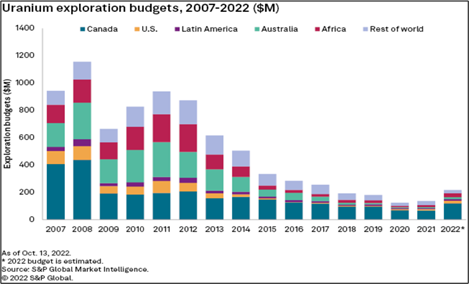
As is the case in many other hard commodity metals, the under-investment in capex in uranium is no different. Exploration capex hit a bottom at ~US$180m in 2020-21 but is expected to pick up slightly in 2022. This is a far cry from peak exploration seen back in 2007-208 when capex averaged $1bn over those two years. At a current price of ~US$55/lb., green-field projects remain economically unattractive, with industry specialists estimating the incentive price to be in the range of ~ $70 -$75/lb.
Conclusion
- Focus on decarbonization and energy security is leading to sharp shifts in policies towards nuclear energy by governments, an ideal complement to other energy sources like gas and renewables.
- The International Energy Agency (IEA) projects more than a doubling of nuclear generation by 2050, with at least thirty countries increasing their use of nuclear power in the Net Zero Emissions by 2050 Scenario.
- The security of supply of nuclear fuel is paramount as national grids rely on baseload nuclear power for stability.
- Current uranium price remains below incentive levels to restart shut-down production and greenfield development.
- Utilities are expected to accelerate purchases of uranium to ensure security of supply and price over the long-term.
- Fuel costs have a small impact on the profitability of nuclear power plants; uranium demand is not price sensitive.
- Existing uranium supply may not meet future demands, encouraging non-utility uranium buyers to enter the market.
- Availability of secondary supplies of uranium have been drawn down over the past few years.
Even in a difficult economic environment characterized by recession concerns and high interest rates, uranium prices have continued to hold firm. Prices for uranium traded solidly above the US$50/pound level in Q2CY23. The market is getting tighter by the year and will reach a flashpoint at some point in future.
Unlike for commodities like oil, high-frequency data such as tons mined or quantity produced/enriched on a monthly basis is hard to come by, given the sensitive nature of the mineral. Hence, the timing of a rally in uranium is extremely difficult to forecast. It suffices to say that the conditions for one are propitious and that the long-term set-up is highly convincing that uranium is set to rally hard in the coming years. Rest assured that we will hear a lot more on this reticent mineral ore in future that will not just make sparks fly but ignite an avalanche of money towards it once the market is convinced of its scarcity.
Buying Exposure to Uranium
How to invest in uranium stocks?
When looking at stocks, investors may want to start with the world’s largest uranium-mining companies. Big miners often provide stability and examples include uranium heavyweights like Cameco in Canada and Kazakhstan’s Kazatomprom, formerly a state-owned entity, with 15% shares now publicly listed.
Of course, these large mining companies are not the last word in the market. In fact, there are quite a few mid-tier and junior uranium exploration companies that investors may want to discover.
How to invest in uranium ETFs?
For investors who want exposure to the uranium market but crave the diversity of a basket of equities instead of single stocks, exchange-traded funds (ETFs) are generally the way to go. The selection of uranium-focused ETFs is not very wide, but luckily for investors the options are growing. For starters, investors can look at the Global X Uranium ETF, which tracks a basket of mining firms. The fund is made up of both American and international uranium miners and producers.
An alternative to that ETF is the VanEck Uranium+Nuclear Energy ETF, which tracks a market-cap-weighted index of companies in the uranium industry. Another option is the Horizons Global Uranium Index ETF. It is designed to give investors exposure to Canadian uranium stocks. It was launched by Horizons ETFs Management in mid-2019.
There is also the Sprott Uranium Miners ETF. It is an international uranium fund comprising companies in Kazakhstan, Canada and the U.S. Using the North Shore Global Uranium Mining Index, the ETF tracks producers and explorers as well as holders of physical uranium.
One of its holdings, the Sprott Physical Uranium Trust (SPUT), is the world’s largest uranium fund that invests solely in physical uranium. SPUT invests and holds uranium in the form of U3O8 in storage locations in the U.S., Canada and France. Investors can buy and sell trust units. SPUT has an NAV of US$14.09 (8/3/23) against which the market price is US$13.37, a discount of ~5.1%. SPUT owns a total of 61.745mn lbs. of U3O8 worth US$3.5bn.
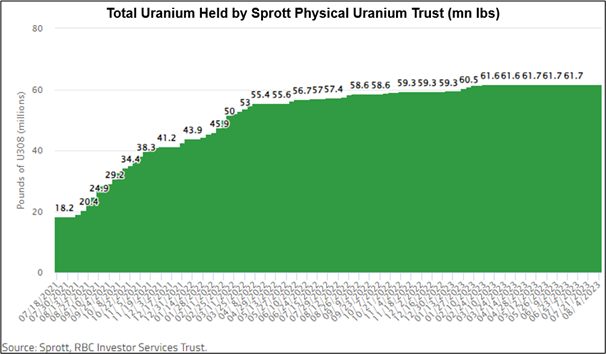
To put the size in perspective, ~70% of France’s electricity comes from nuclear energy, requiring approximately 18 million pounds of U3O8 per year according to the World Nuclear Association.
If shares of the SPUT trade at a 1% premium to NAV, the trust can issue additional units to the market. The trust then buys pounds of uranium with the proceeds, which increases the fund’s NAV and takes off physical pounds from the uranium market.
Note, however, that this does not work the other way around. Even if SPUT trades at a discount to NAV, the share count of the trust remains the same. Therefore, liquidity plays a huge role for the ability of SPUT to accumulate U3O8. Note that the fastest pace of accumulation was right after Sprott Inc. (SII) launched its SPUT vehicle. That was during 2021, when liquidity was much easier and financial conditions were not tight.
One can well imagine that SPUT could influence the uranium market and lead to significantly higher prices if the liquidity inflows are sufficient large.
APPENDIX: Sprott Physical Uranium Trust

Cover image by vectorjuice on Freepik
End
Disclaimer
This material is not intended as an offer or solicitation for the purchase or sale of any financial instrument. Information has been obtained from sources believed to be reliable. However, neither its accuracy and completeness, nor the opinions based thereon are guaranteed. Opinions and estimates constitute our judgement as of the date of this material and are subject to change without notice. Past performance is not indicative of future results. This information is directed at accredited investors and institutional investors only.
