The US: High Corporate Earnings Growth Is Peaking Out
As is known, in the long run, corporate earnings are the primary drivers of market return. The stellar returns from the US market since 2010 – compounding at 12% p.a. total returns – were largely underpinned by a strong EPS growth of 8.7% p.a. The rest came from dividend at 1.5% p.a. and valuation at about 1.8% p.a. In this newsletter, we will try to understand the source and repeatability of this strong return.
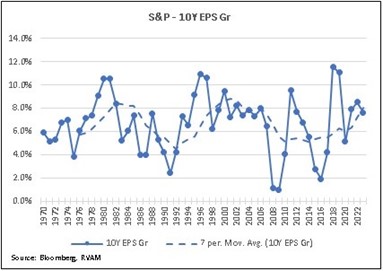
EPS growth at historic high
In the chart alongside, we have plotted the 10-year rolling EPS CAGR for the S&P index from 1970 to 2023. Additionally, we have plotted a 7-year moving average to smoothen this out. Both currently point to a growth history (at about 8% p.a.) which is at the upper end of the range at which EPS has historically compounded. Market behaviour in terms of expectations is highly influenced by the most immediate historic medium-term growth that the market sees. Hence, our view is that the US market intrinsically believes that S&P earnings can compound at the 8%-odd compounding number they are seeing when they look back today. While we believe that there is a high likelihood the actual numbers will be much lower over the next 5-10 years, even if we are wrong, the market is already pricing in very high expectations compared to history.
Analysing the components of the strong EPS growth of S&P over the past decade
A good way to understand whether the strong EPS growth since 2010 is repeatable is to look at the components of this growth:

We elaborate on the above table in the section below.
A. GDP growth: US GDP growth as the broad driver has remained constant over the 2000-2010 and the 2010-2022 period. We expect this to remain so going forward and hence this is neutral from a corporate earnings growth point of view.
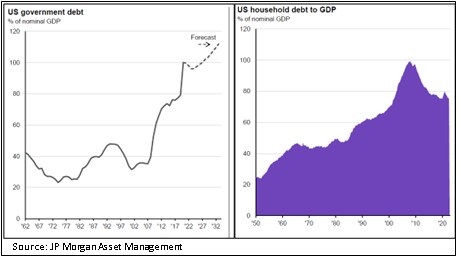
B. Sales growth had accelerated but could reverse: S&P sales growth accelerated from a long-term rate of 3.5-4% p.a. to 5.7% p.a. over the 2010-2022 period. This is perhaps a sign of further globalisation of US companies and potentially a market share gain by the organised sector (as represented by the S&P constituents) compared to the unorganised sector. Another source is the overall outstanding debt in the system. While the household debt to GDP has gone down, the government debt to GDP has grown dramatically, leading to an overall sharp increase in debt to GDP. We believe this trend will slow down dramatically with increasing interest rates. Additionally, the sharp increase in the debt so far will lead to US government interest payments going from 1.5% of GDP in 2022 to 3.5% of GDP in 2032, becoming a further drag on corporate revenue growth. Hence, we believe S&P revenue growth will trend back to its long-term growth rate of ~3.5-4% p.a. This source of historic EPS growth is weakening.
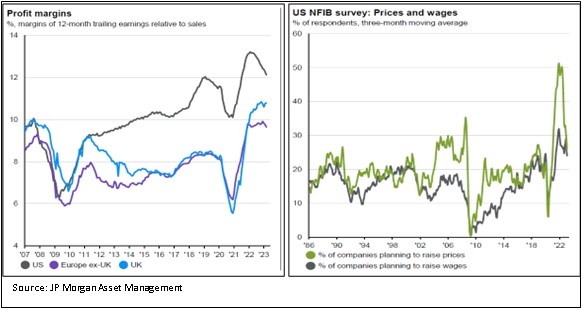
C. EBIT margin improvement has peaked: It has been a source of wonderment to economic watchers that corporate profit margins kept increasing and corporate profits (as a % of GDP) kept finding new highs. During the 2010-2022 period, corporate margins moved up markedly across the world, but especially so in the US. At the same time in the US, headline margins moved up by about 2-3% as seen in the chart. In simple terms, shareholders’ share of revenues increased 2-3% at the cost of other stakeholders like labour. This latter point is shown in the chart. Historically, only 10-20% of US companies at any time planned to increase wages in the following year but now that number has jumped to the 25-30% range. Hence, labour’s share of revenue is expected to start moving up, leading to US margins coming under pressure. This is another source of historical EPS growth that is peaking out.
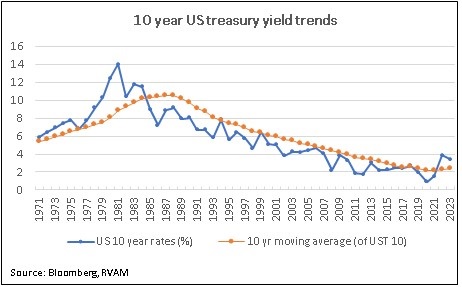
D. Interest load reduction could reverse: We all know that interest rates have been going down for the past nearly 40 years. But even in the past decade, rates have moved down from about 4% to about 2% (moving average). With the current sharp reversal of rates in the past 18 months, this trend has decisively turned and is slowly filtering into the interest cost of corporates. From 2010-2022 for S&P companies interest load dropped from about 3.5% of sales to about 1.7% of sales. This is very likely reversing. This is another historical source of EPS growth reversing out.
E & F. Buy backs could flatten out: This is a hot topic today, especially in cash rich sectors like energy and tech. Here, the companies are announcing large buy backs while either showing no growth in capex or initiating strong reduction in employee numbers. This is the classic battle between buy backs (which primarily benefit shareholders) versus capex (which increases employment and economic activity). Over the period 2000-2018, annual US buy backs have moved from 1.8% of US market cap to 3.6%, while capex has moved from 4.1% of market cap to 3.4%. Clearly, the buyback camp has won. This explains talks of legislations which tax buy backs and incentivise capex. This is another source of EPS growth that is potentially losing steam.
Hence, all the drivers of the above average market EPS growth of the past 12 years are peaking out – GDP growth, revenue growth, margin improvement, low interest burden and strong buy backs. Therefore, we believe that the forward EPS growth will probably be much lower than the 8.7% p.a. we saw in the 2010-2022 period.
The US: Other Drivers Of Market Returns Are Also Maxing Out
As shown above, over the 2010-2022 period, total US market return has been about 12% per annum. EPS growth was 8.7%, dividend was 1.5% p.a. and finally valuation rerating was 1.8% p.a. as multiples moved from about 14x to over 18x. While the first factor is slowing down and the second one will probably remain steady, the last factor could turn neutral to negative.
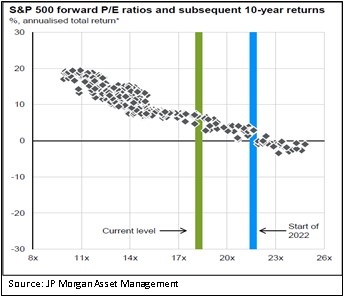
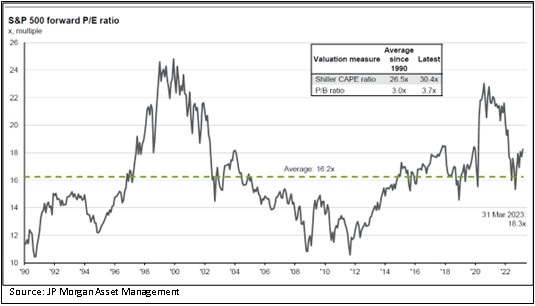
The current PE of about 18.2x is at the higher end of the last 32-year range (leaving out the dot com euphoria and the Covid earnings collapse). More importantly, as the chart below shows, the forward 10 year total return from a current starting valuation is more in the 5-7% per annum range, a huge drop from the 12% p.a. seen in the past. This again triangulates well with a 1.5% dividend yield and a 3.5-5.5% capital return that we expect, with the latter coming from a 4.5-6.5% p.a. EPS growth and an about 1% p.a. derating in valuation (i.e. PE derating from the current 18.2% to about 16.5% in 10 years).
Conclusion
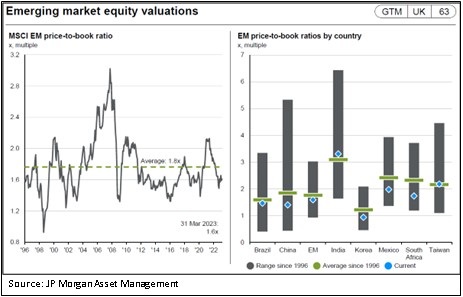
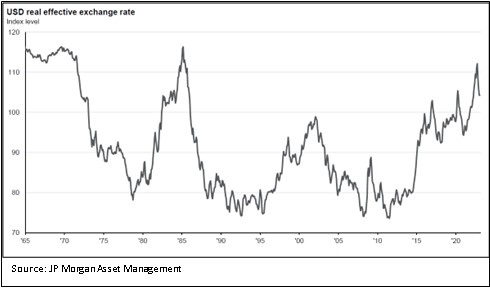
We conclude that over the next ten years, the US market is going to struggle to give even half the annual return it has given over the past twelve years. This is a combination of slowing EPS growth and only a marginal derating. Asia and EM seem the opposite, especially on the valuation front. Even on the currency front, US is near historic highs (see chart below) and could reverse. This is normally good for non-US assets. Hence, we believe that Asia needs a much larger allocation compared to what is represented in global indices today.
End
Disclaimer
This material is not intended as an offer or solicitation for the purchase or sale of any financial instrument. Information has been obtained from sources believed to be reliable. However, neither its accuracy and completeness, nor the opinions based thereon are guaranteed. Opinions and estimates constitute our judgement as of the date of this material and are subject to change without notice. Past performance is not indicative of future results. This information is directed at accredited investors and institutional investors only.
